
Order Flow Analysis And Trading Recap February 29, 2016
I took 4 trades on Monday February 29, 2016. 2 in the ES and 2 in the ZB.
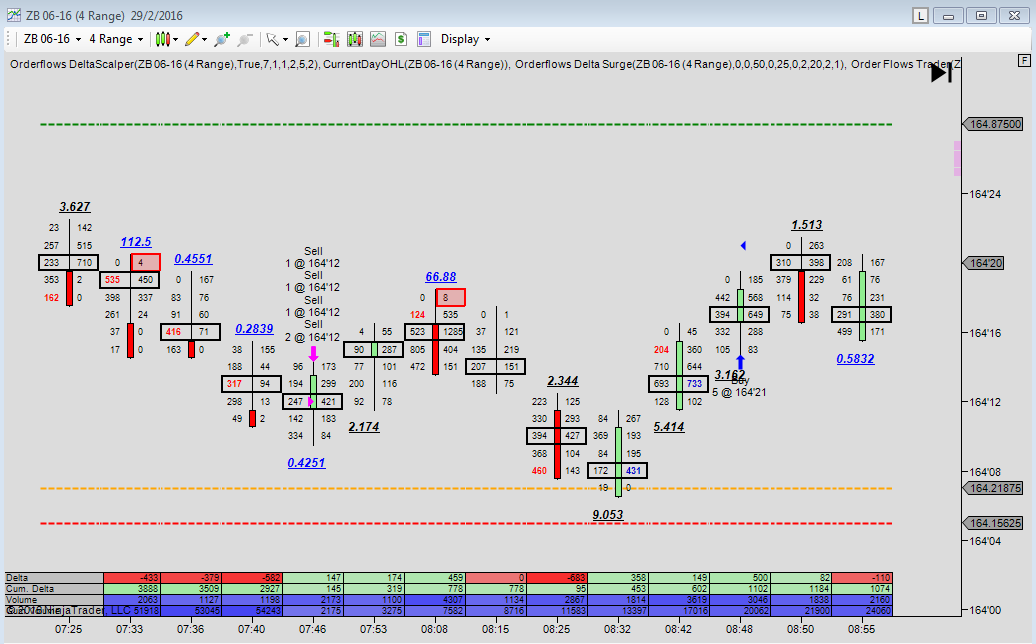
The first trade was in the ZB which resulted in a loss. I got short at 164-12 with a stop at 164-21. This trade never really worked out for me at all. It did get as low as 164-07 before turning and going to my stop price. The reason I got short was the 3 ratios. I was looking for a little bounce up and a run to the lows at 164-05. Realistically I was expecting to take out the lows and get closer to 164-03. I got stopped out.
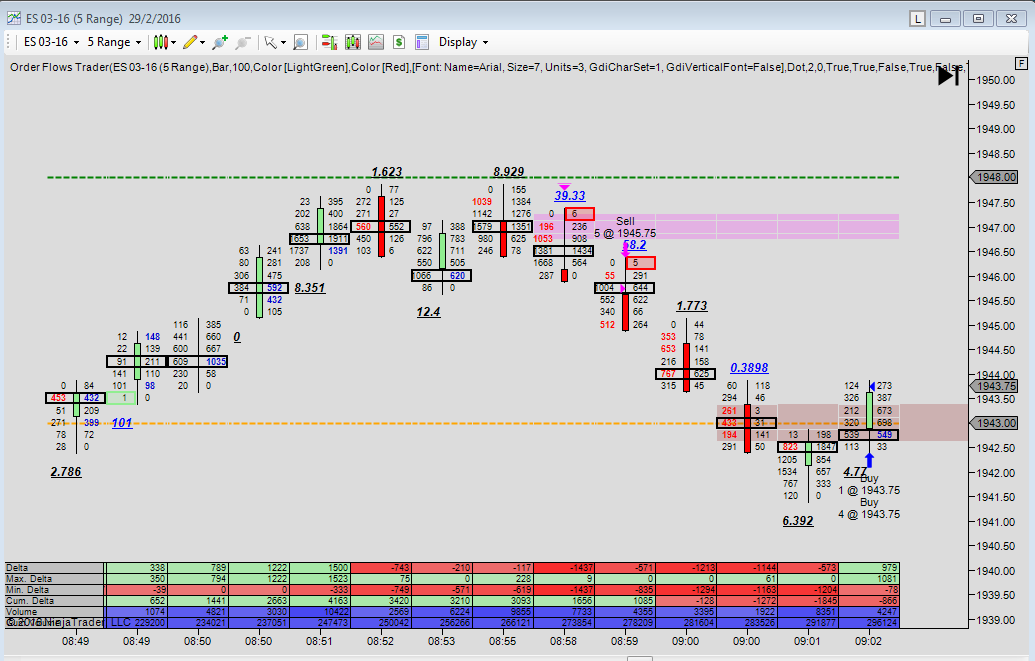
The second trade was in the ES. I got short at 1945.75 on the back of the failure of the test of the high and then the single print. I got a little greedy as I saw a lot of selling coming in with the selling imbalances and the ratio bounds low. My greed cost me a couple of points. Instead of getting out at 1941.75 or 1942.75 even, I ended up covering the trade at 1943.75.
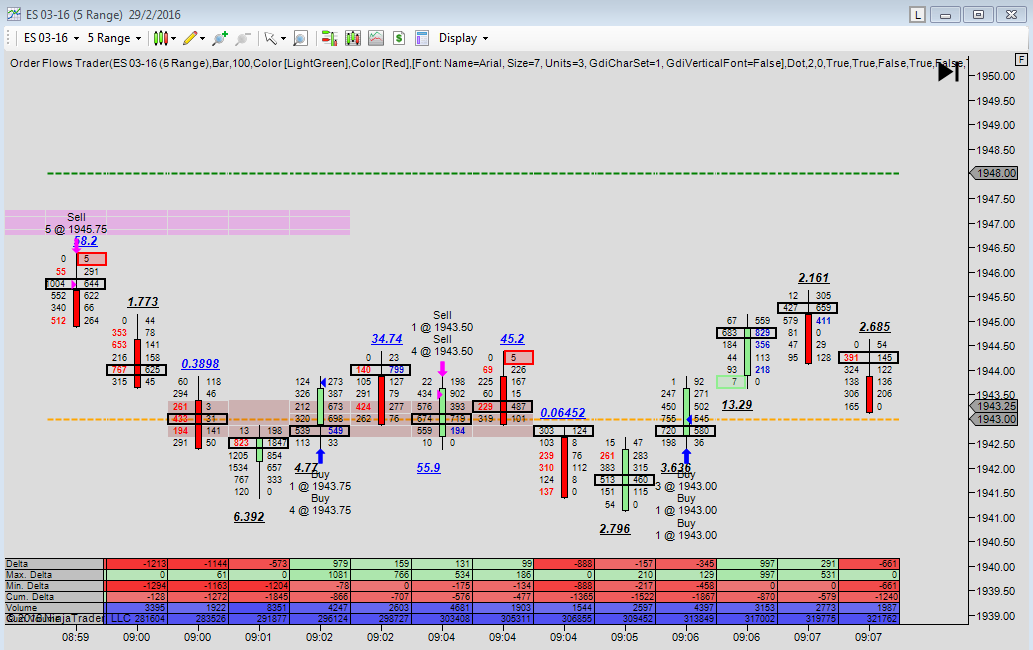
The third trade was a quick one. I got short at 1943.50, looking for a move to the 1940 level based on the small print ratio and the imbalance at the 9:02am bar. At 9:04am there was a pair of ratios and 3 selling imbalances that made me feel like I could get a little more out of the trade. Usually I go for about 2 points on this type of trade. However the market immediately turned higher and I decided to cover for a small winner at 1943.00.
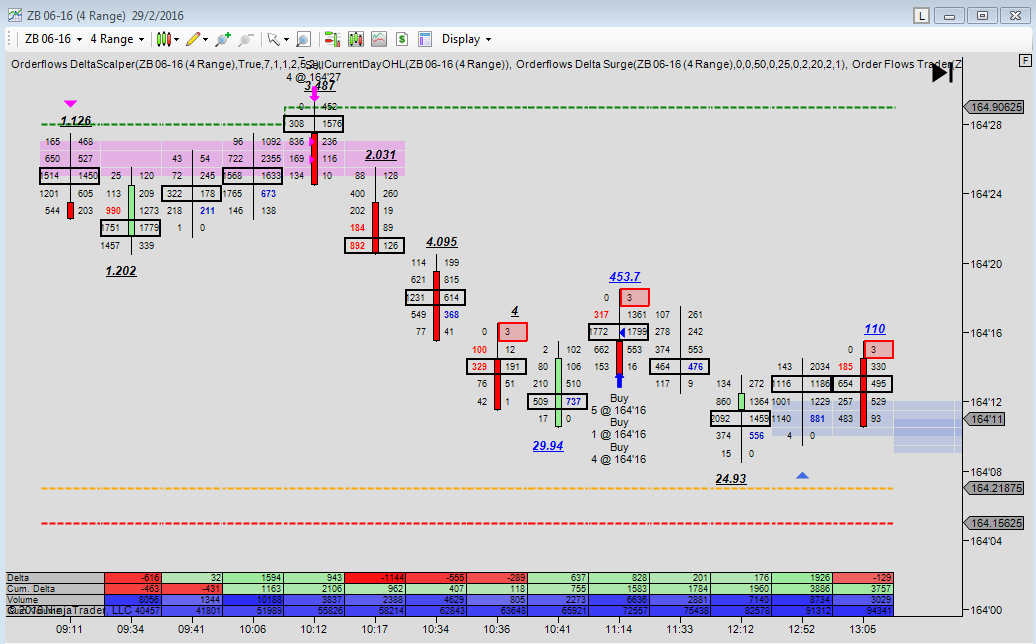
The fourth trade was in the bonds. At the time, the SP were making new highs and the ZB was still at their highs. Why were the bonds not selling off. They were still showing strength. The bonds had just made a new high by a tick. The POC was near the top. I felt confident in shorting the bonds because there was a lot of buying right at the high and the price just below it, 164-29 and 164-28, but now the market was stalling. You could consider these traders trapped. What I saw what a lot of buying but the buyers were not able to move the market any higher and was ripe for a sell off. I got short at 164-26 and 164-27. If the market was going to make a new high the reason for getting short would be invalidated. That is where my stop was. The market sold off nicely and I covered everything at 164-16.
If I was looking at any other type of chart, a bar chart or a candlestick chart, I would have not have been able to find these trades. You can only find these trades with an order flow footprint chart.
If you are not using order flow in your trading, perhaps you should.
Happy Trading.