Secret 2) Treat trading as a business. Be serious about it and always try to improve yourself.
Secret 3) Don’t get caught up in the excitement, leave your emotions at the door and keep focused and calm. Easier said than done, but money people start seeing results, get carried away and lose their focus. Don’t be a victim of your emotions.
Secret 4) At the end of trading session, give yourself and your trading actions a review of your success and failures. Analyse what you did and why, so you are more aware of your own actions as they happen next time. This will help avoid the same mistakes.
Secret 5) Motivation is the key to long-term success. Forget about the winning or losing. This clouds your judgement. Instead focus on the process. By doing so, you allow success to come as a result of your trading.
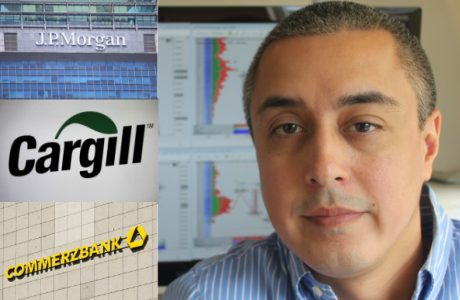
I almost wish I could have one of those ‘interesting’ stories about how I lived in my parent’s basement, was flat broke and struggling trading until I found the "Holy Grail," but the honest truth is that’s not what happened. I came from an upper middle class family. Growing up some of my friends dad’s were traders at the CME and CBOT. I had always dreamed of being a trader. While in college I worked full-time in a grocery store. After graduating college with a degree in Economics I took the summer off until I ran out of money. A former colleague from working in the grocery store recommended me as a management trainee with a big national grocery chain. After a year I was already a manager, making actually decent money and on a career track. It was a solid job, I mean everyone has to eat so they have to buy groceries. But I knew deep down that working in a grocery store was not what I wanted to do with my life. I wanted to be a trader. I had friends working on the CME floor and telling me about the excitement of first walking onto the trading floor. I was fortunate to get an introduction to the CME floor manager for Dean Witter who hired me.
When I got into Futures industry I started at the bottom - I worked as a runner on the CME floor for Dean Witter earning the princely sum of $6.25 an hour, which for a runner on the CME floor in the early 1990's was on the high side. I worked hard to learn anything and everything I could from everyone I who would talk to me. I was like a sponge. Some people may say that I was in the right place at the right time, but what I did was position myself to be in the right position through hard work.
I worked my way up and eventually off the CME floor with Dean Witter, then moving to EDF Man, Commerzbank, Cargill and finally JP Morgan. In 2013, 3 months the birth of my daughter I decided to leave JP Morgan. It was a life changing decision. Going from a cushy job at one of the biggest investment banks to trading from myself in a home office. But that is what trading offers - financial freedom. Big money can be made, but at the same time, life savings can be lost just as easily. You only hear the success stories in trading you don't hear the failures, and there have been some spectacular failures of individual fortunes lost. But I can't stress it enough, you can lose everything trading. In some cases I have seen people lose more than money. I am talking about families and even their own lives.But I digress...In 2015 I started Orderflows.com to help bring my way of trading order flow to the public. Along the way I have met some very great retail traders. I have also watched people struggle over and over and have come to realize that traders can go further with a bit of extra help and guidance to get better results. I’m also aware that for a lot of people the cost of hiring a one-on-one personal trading coach is prohibitively expensive. I want to help your trading but I am not trying to become your personal trading coach, instead I want to get you on the right track.
I am always happy to discuss the markets and order flow with anyone, but I realize there are some who view order flow as some get rich quick scheme and there are those who are more serious and see it as the right way to trade. If the former describes you then the Inner Circle will benefit you.
To me order flow is the only way to trade. After using a footprint chart for the first time I was never wanted to look at a normal bar chart again. I still look at bar charts the only difference is they have volume footprints wrapped around them.
First of all I want to stress that with the Orderflows Trader you have everything you need to look at the markets in a way that puts you head and shoulders above the trading crowd. But what if you want advanced order flow and trading knowledge? Where are you going to get that knowledge? A trading forum from some anonymous kid posting under the name biglips69? Does he have the background? Who knows. Does he have the experience? Doubtful. Has be ever traded?
Today, I’ve decided to re-open the Inner Circle for a five traders who want to take their trading to the next level, who want to learn more, who want to share their thoughts and who are tired of all of the B.S. out there. The Inner Circle is more than just information, I am also including FREE access to the trading indicators that I have programmed to help read and analyze order flow. The indicators portion of the Inner Circle is worth the joining price.
Join the Inner Circle and I’ll pull back the curtain.

You will get my new order flow indicators for free. Many of these indicators will never be released to the public. These are indicators I will be using in my own personal trading. Honestly, before working with my programmer, I didn’t think many of these order flow indicators could be programmed. I have a whole notebook of indicators to be coded over the next year. It will be one new indicator every 2-3 months, so about one every other month. The indicators alone are worth the membership price.
Private webinars where you get in depth training. Each and every week you’ll get access to private webinars. The webinars are recorded and only members will have access to them. These are not webinars recorded for my YouTube channel, instead these webinars are made solely for the Inner Circle and cover advanced material. Each webinar will be recorded and available for you to watch at your leisure. I say these webinars are almost weekly once in a while I take a week off.

Personal trading secrets I haven’t shared before. While I tried to share as much as possible I realized that there is quite a bit I didn’t cover. Even in the Order Flow Trading Course, I shared more and more, but still there were many things I just didn’t have the time to put in as their concepts are more advanced. This is proprietary information.
.

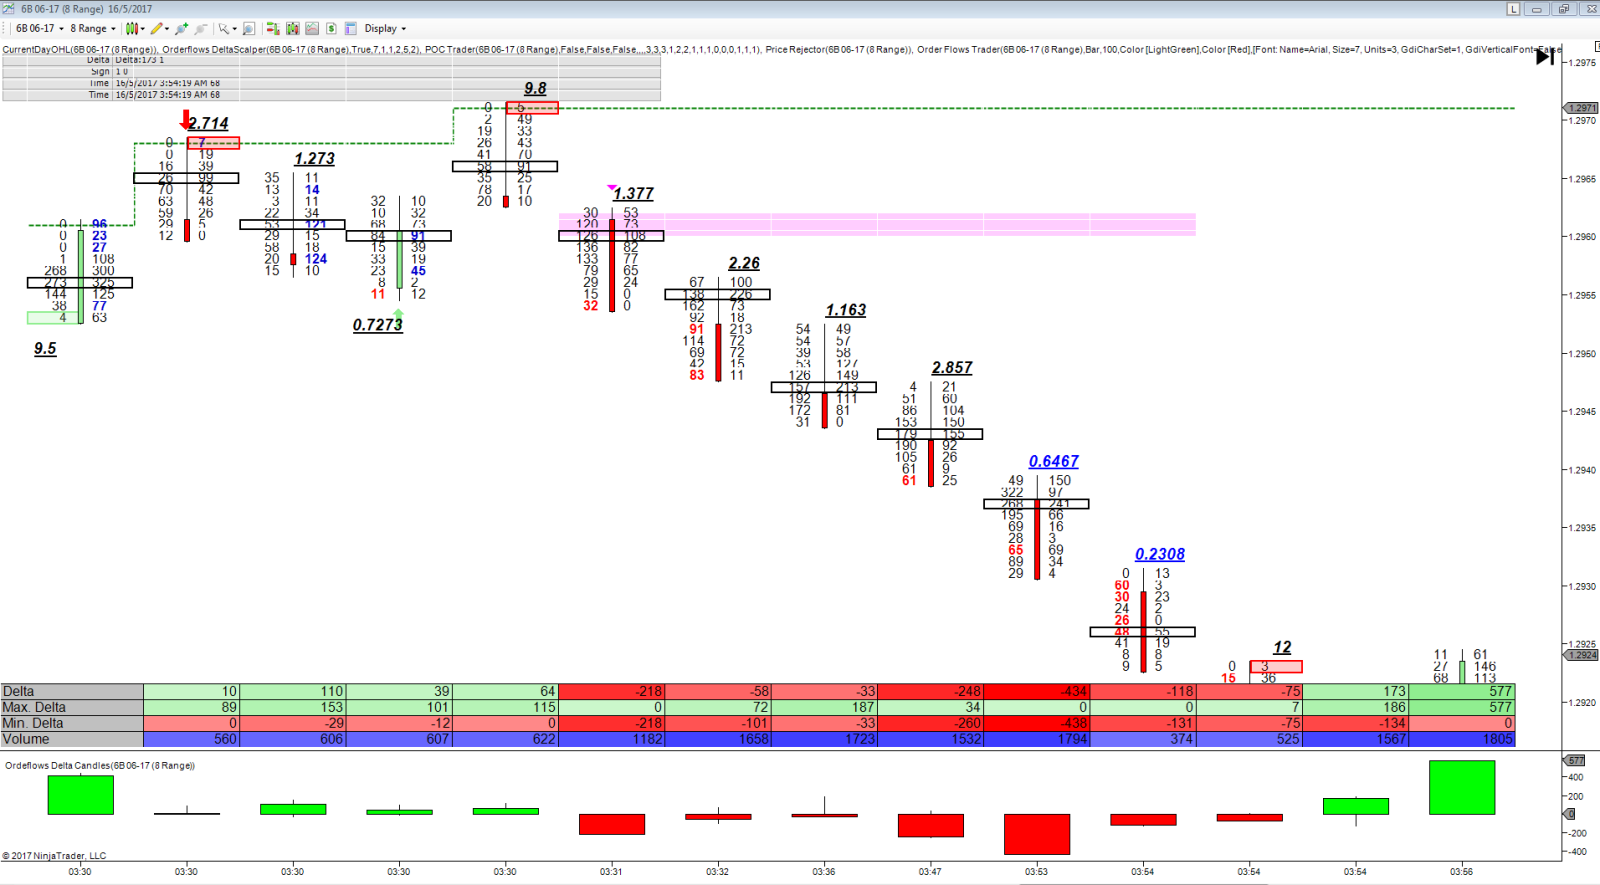
The Price Rejector for NT7 and NT8 - Not all prices are the same. The Reason So Many Traders Lose Money With Price Based Indicators Is They Focus Only On Price. They Don't Take Into Account Market Participation At Price. Price Based Indicators Fail Because They Do Measure The Strength, Or, More Importantly, Lack Of Strength At The End Of A Move. That Is Why I Created The Price Rejector. The NUMBER ONE reason most traders fail is they think all prices traded are created equal. Not all prices are the same. This is especially true as the market makes highs and lows. The market exists to facilitate trade to. To find price levels where both buyers and sellers can trade and be happy, in other words a "fair price". In order to find this fair price level the market will go up and go down. A market will move up and up as traders buy and buy, however as the market reaches its high price level, the level where traders think it too expensive to buy, then buying activity becomes less, selling takes over and the market starts to drop. The opposite is true when the market is moving lower and lower as traders sell and sell. The market reaches a point where price is just to cheap to sell anymore and selling activity becomes less and less, buying takes over and the market starts to rally. This is what the Price Rejector looks for. It looks for areas in the market where price is being rejected by analyzing the order flow on several factors:
- Volume traded on the bid and offer.
- Recent price action
- Market imbalance
- Determines if the market has been trending or trading in a range.
The POC Cheatsheet - a printable sheet of important POC you should look for.
The Orderflows Delta Candles for NT7 and NT8 - is the second I have released since the start of the Inner Circle. This indicator puts the order flow delta into an easy to read Japanese Candlestick style format. You can forget about having to try and analyze the delta, simply look at the delta candle to help your trading decision.
The Delta Candle Cheatsheet - a printable sheet of important delta candle formations you should look for.
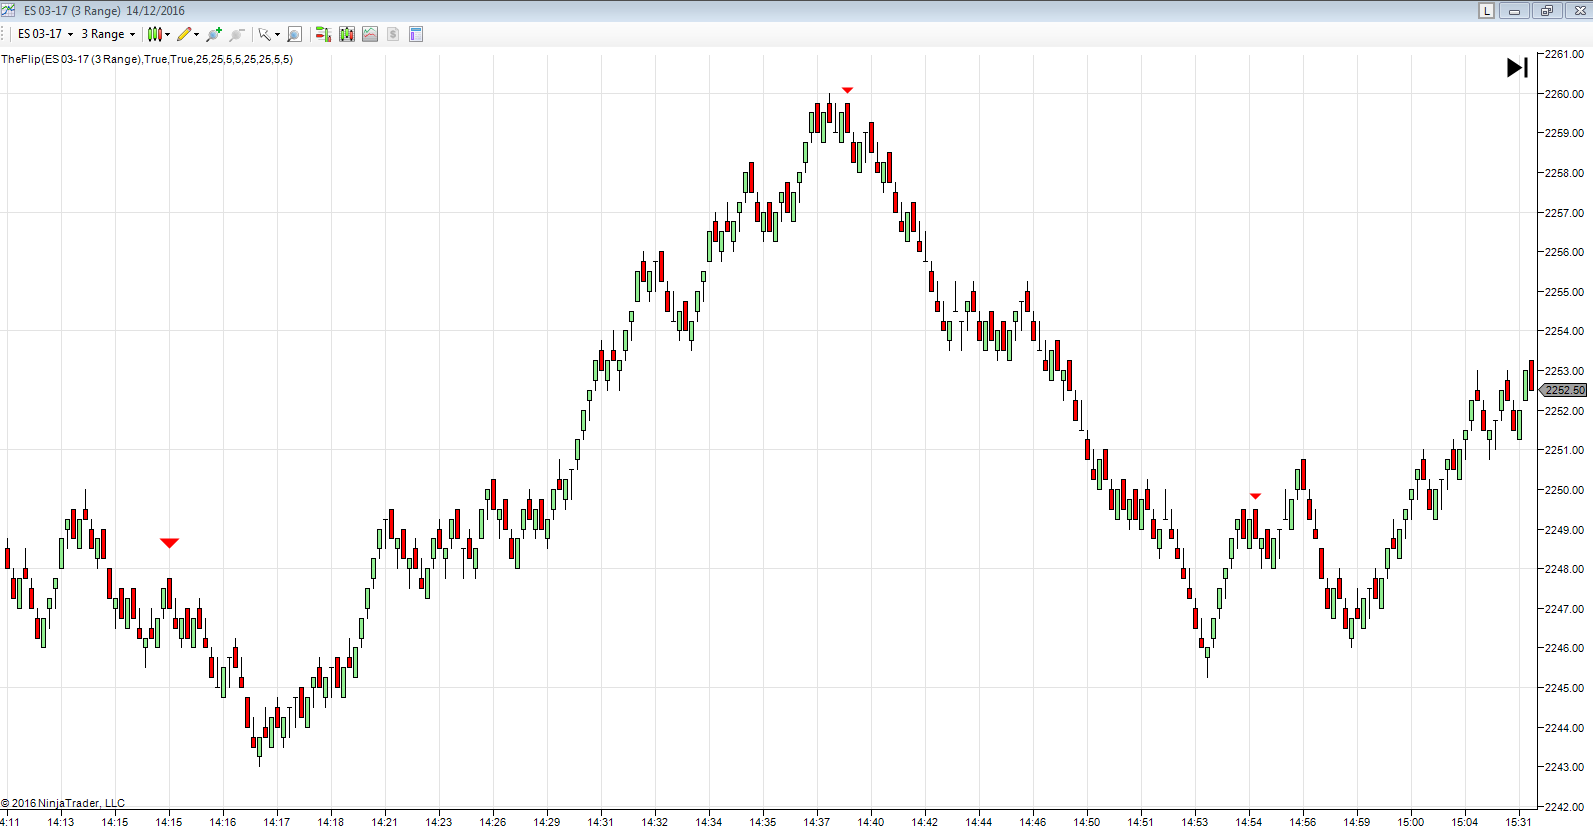
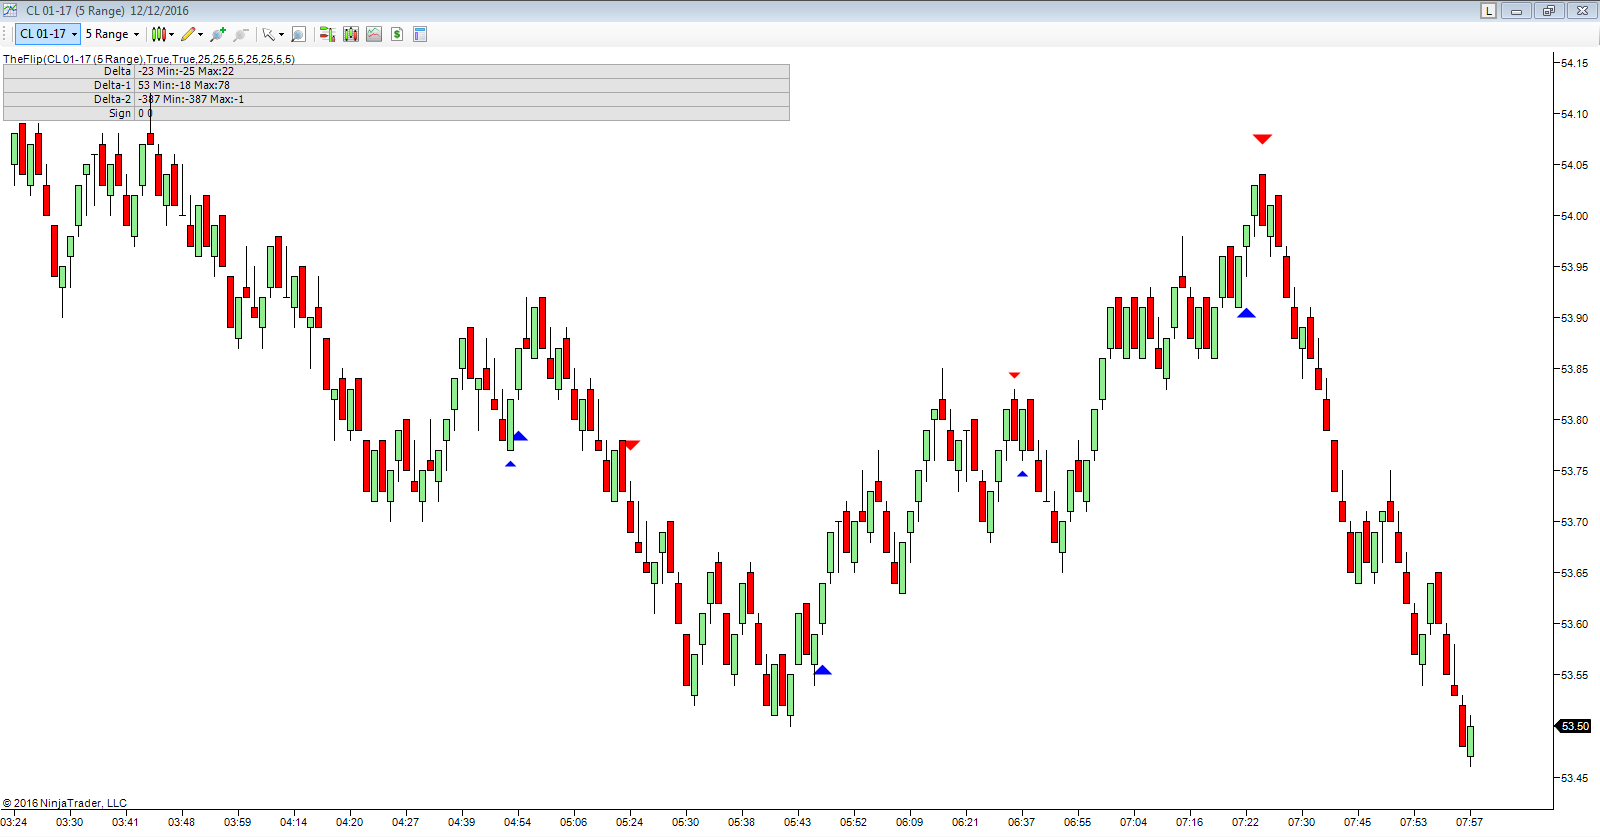
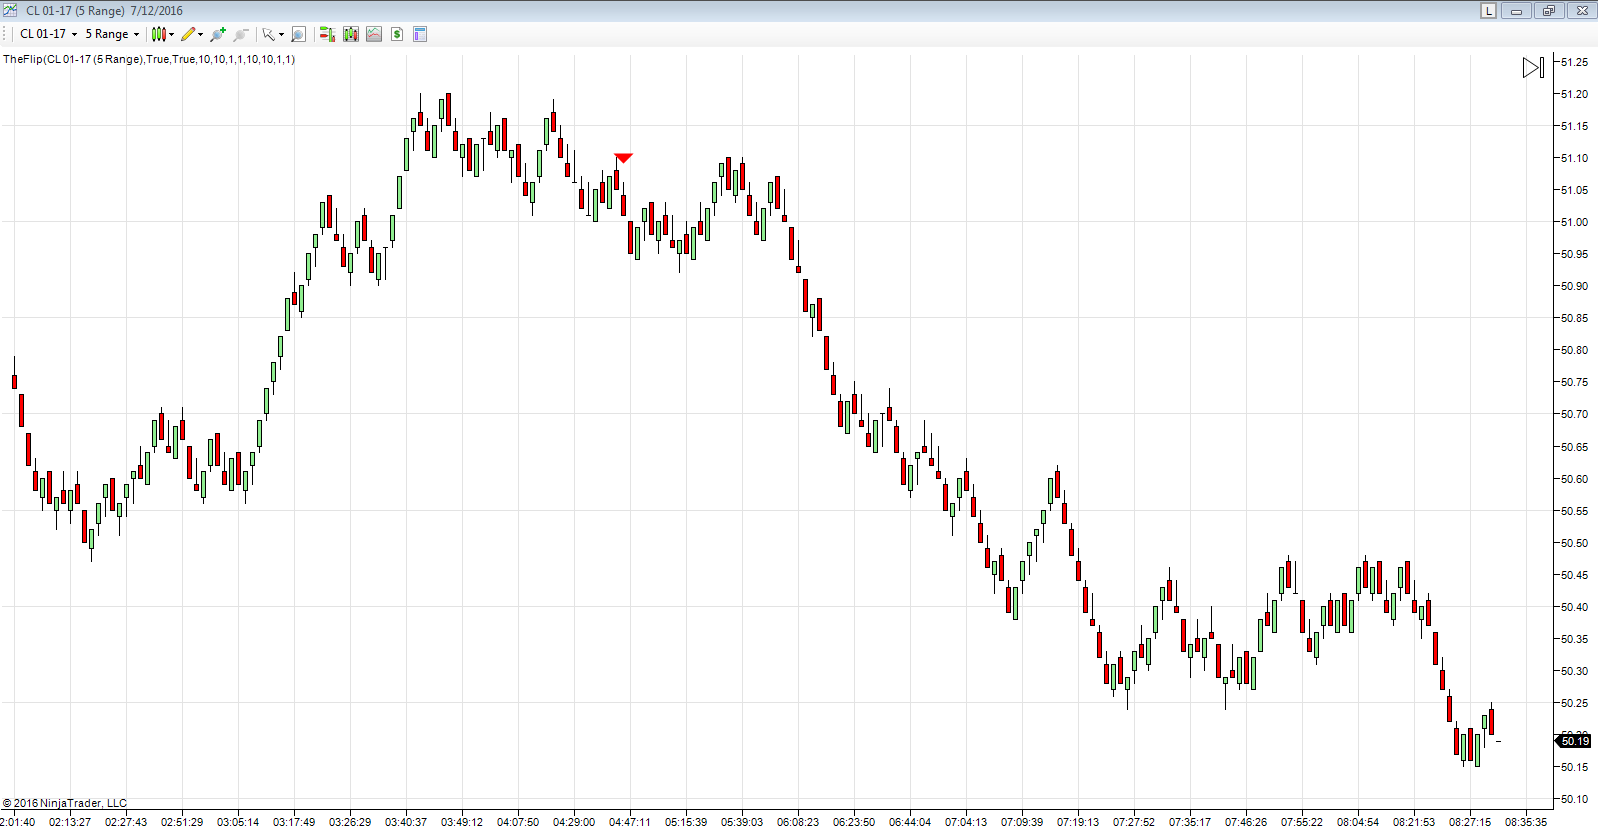
The Orderflows Flip for NT7 Only - this indicator is a short term indicator that catched some really big moves. If you have been around the market in the early 2000's you will have likely heard of Paul Rotter, aka "The Flipper." While the Flipper would benefit from essentially spoofing the market with large orders in the book, often times on both sides of the market, he was often exposed to getting filled on orders he might have had no intention of getting filled on. HFT's face a similar problem, they are often working bids and offers, but when someone comes in and sweeps the book, they are at risk and need to cover their position. The Flip catches some of the more explosive moves in the market as traders feed on each other.
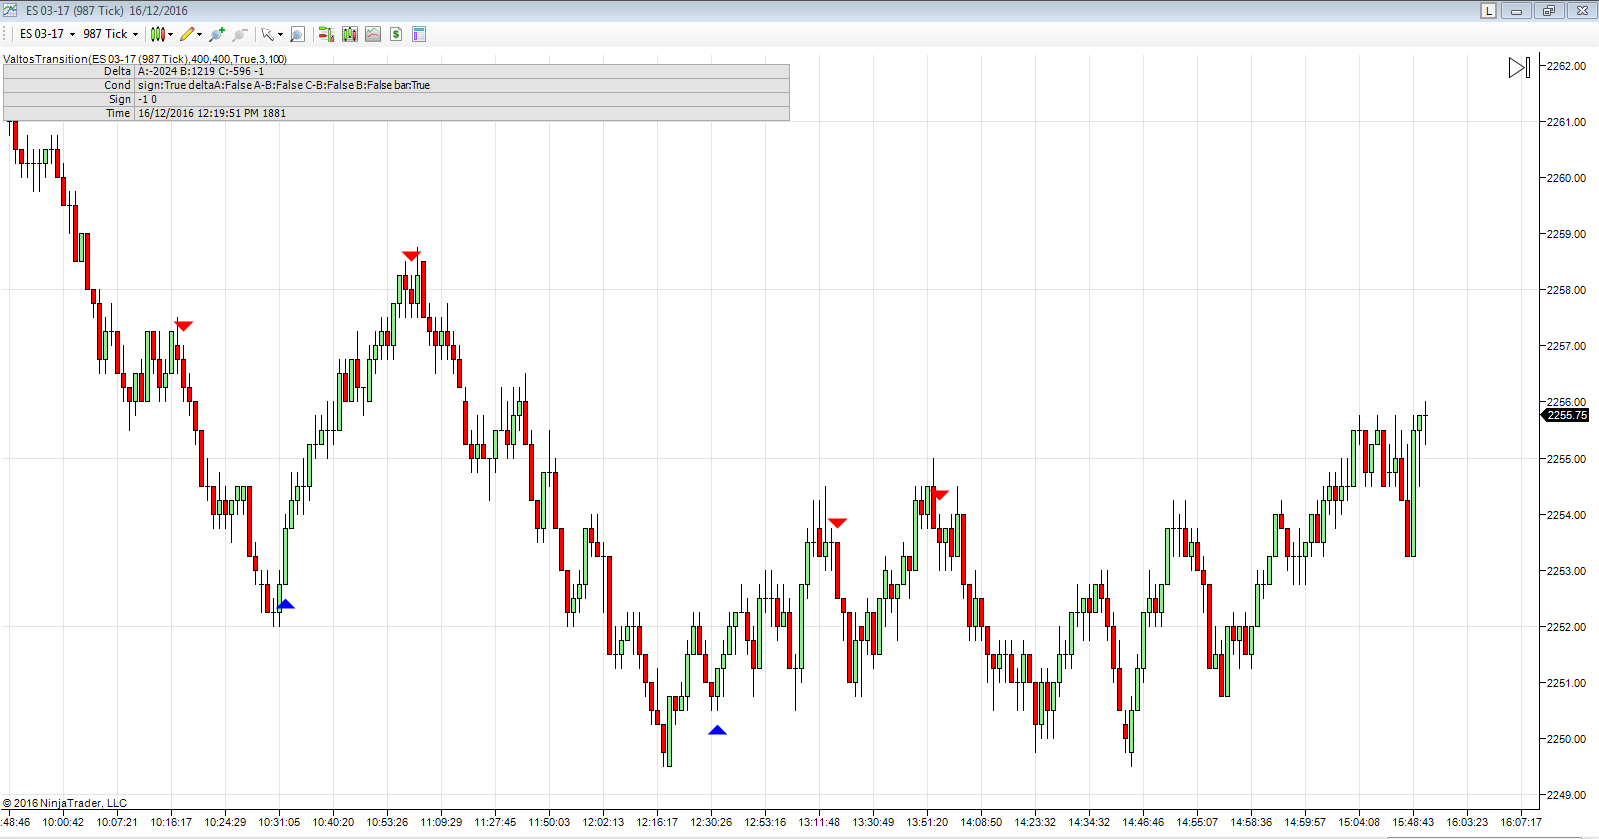
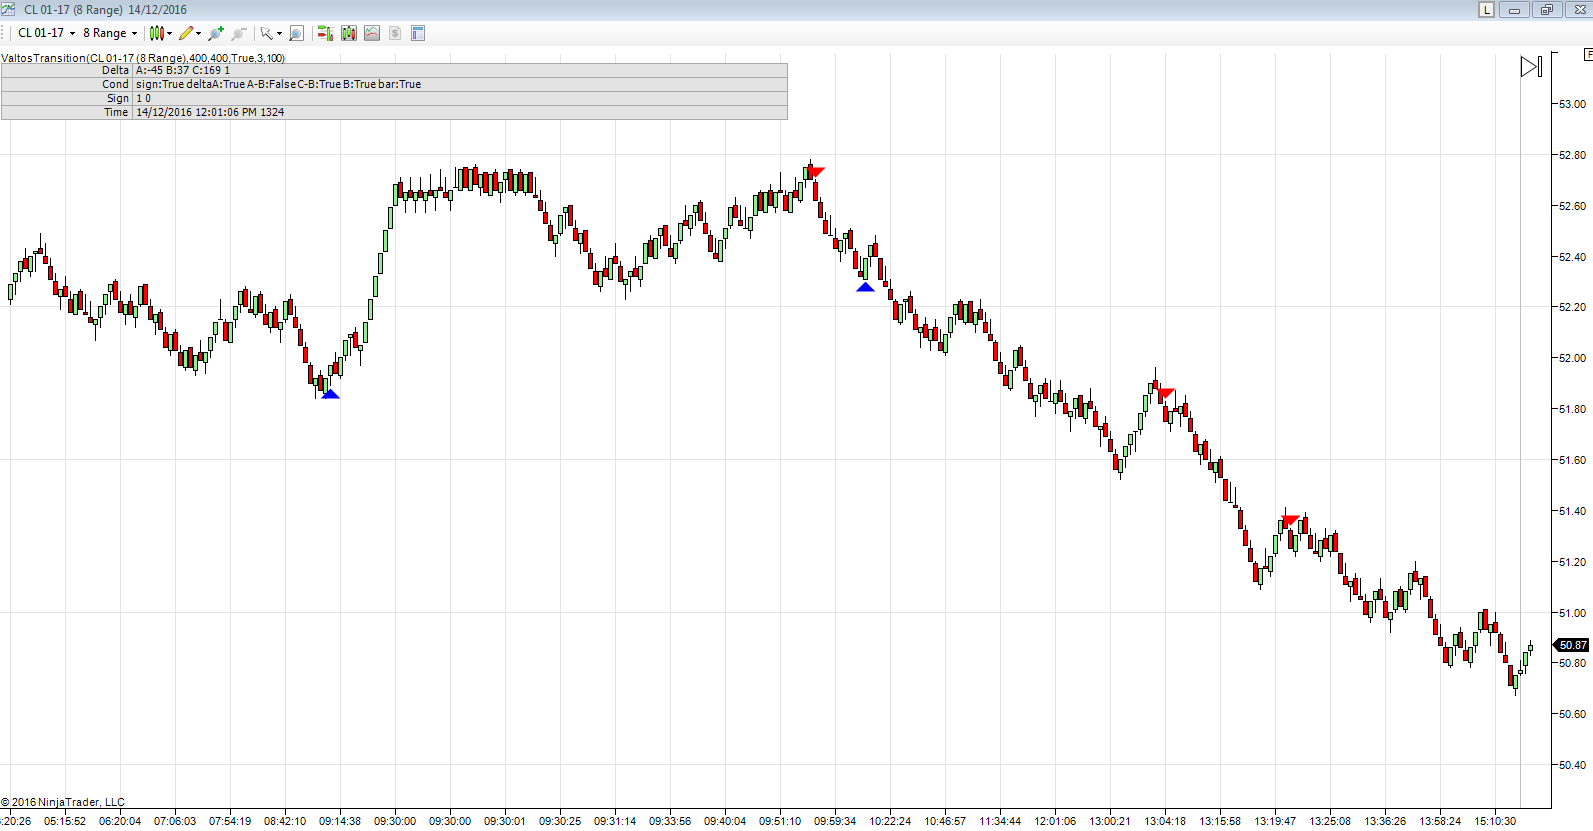
The Valtos Transition for NT7 Only - Shows when a market is moving from a supply driven market to a demand driven market. This transition is important because that is where trends start. The big moves every trader wants to get in on.
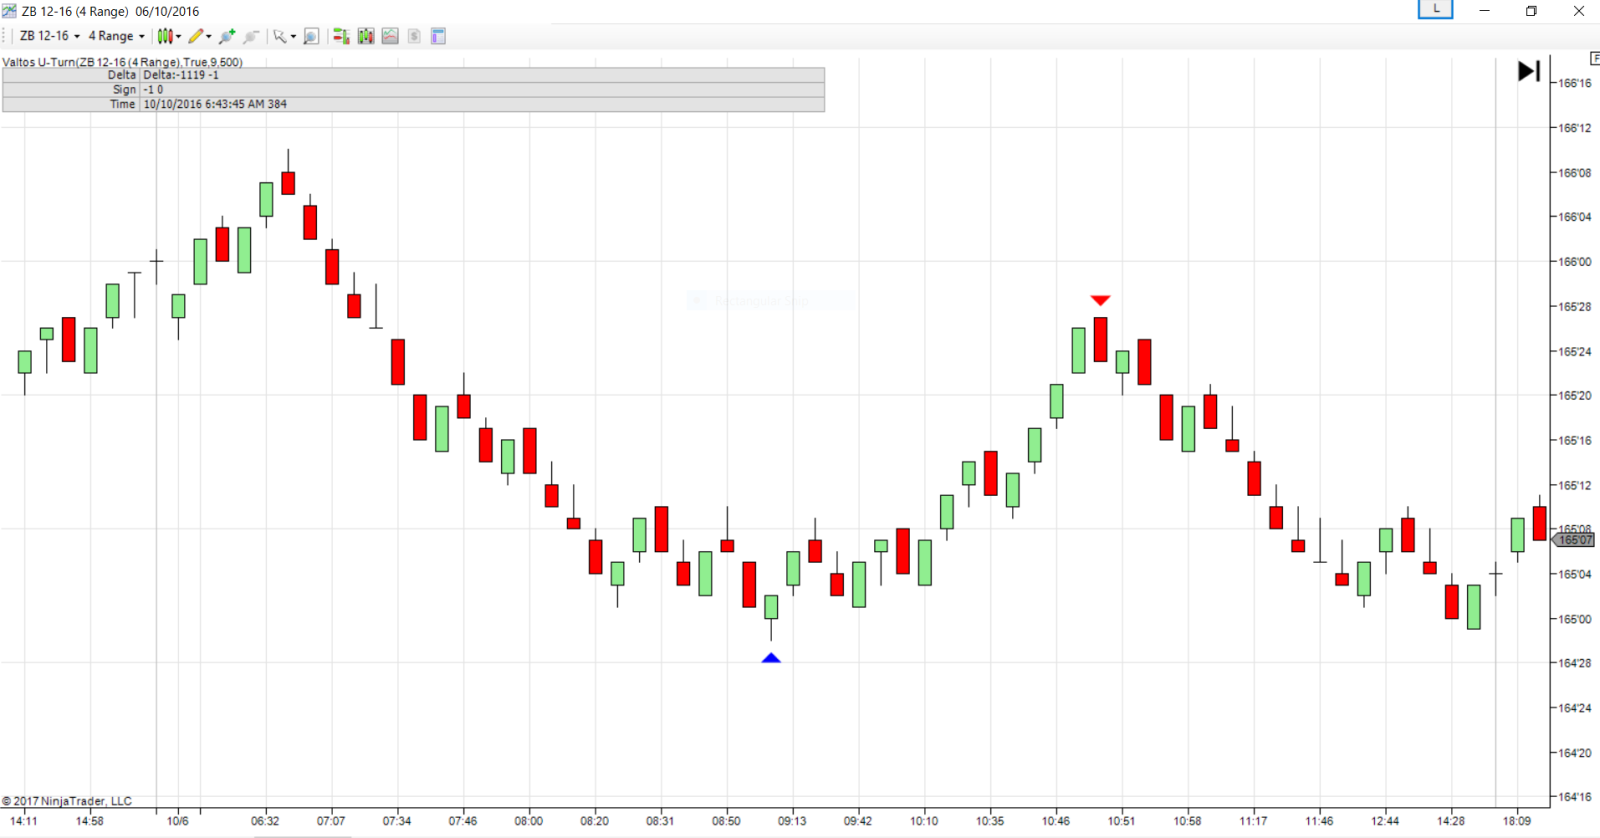
The Valtos U-Turn for NT7 Only - My latest indicator. The best way to describe this indicator is understanding what is not happening that should be happening is just as important as what is happening. Confused? Don't be. A good trader know how a market should act based on the order flow and when the opposite happens the good trader recognizes it and acts accordingly. There are times when what is happening is running counter to what should be happening. This is where great trading opportunities exist.
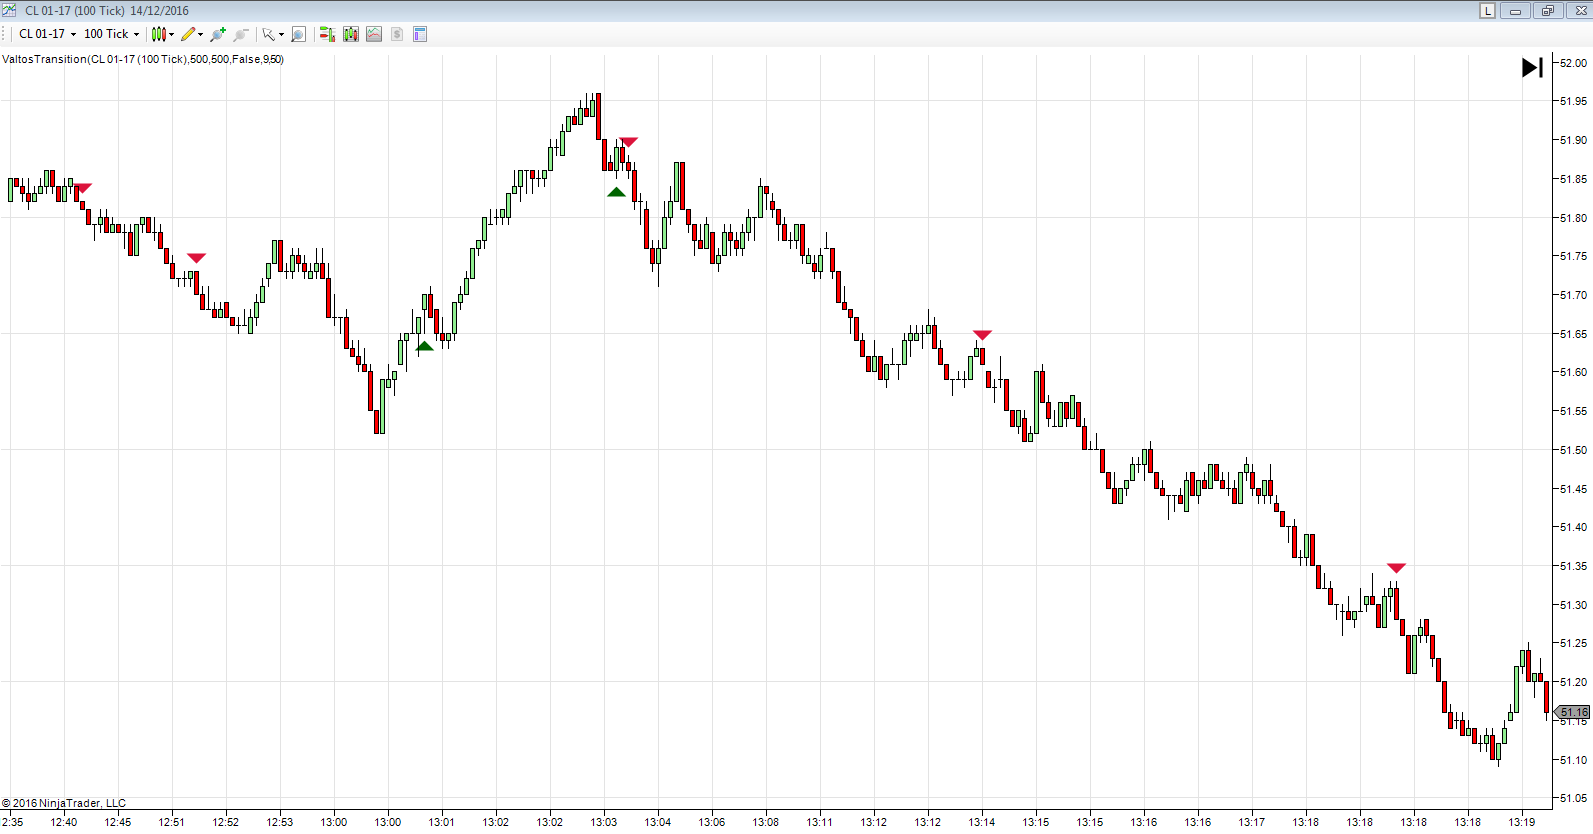
My indicators run on both Orderflows Trader generated charts as well as normal candlestick charts.
Here is are some examples of the power of the indicators:
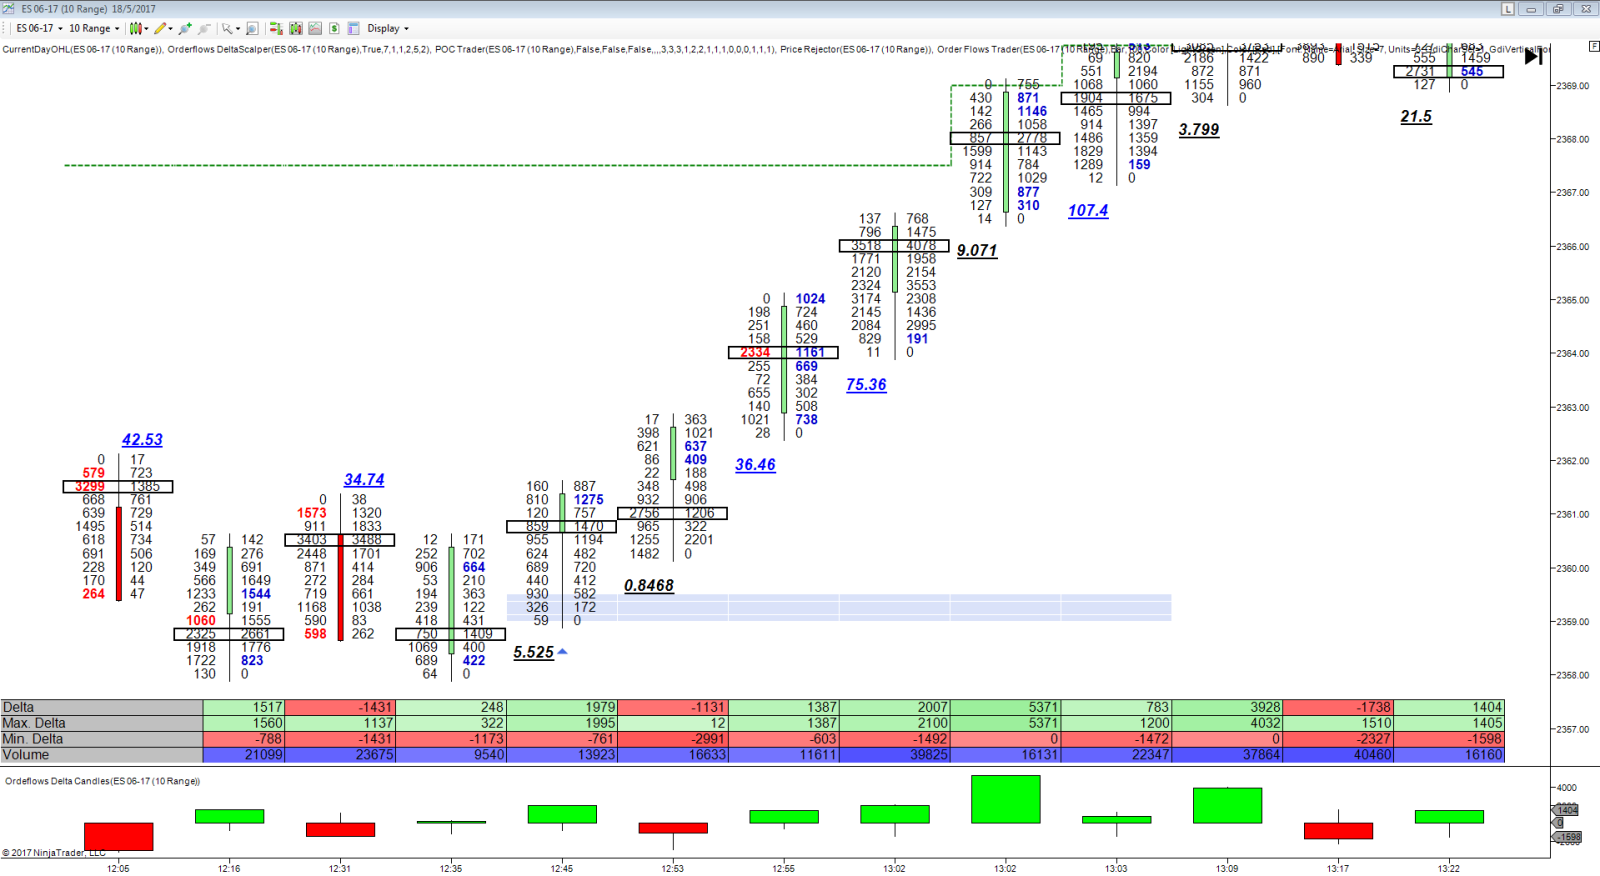


(Available for download in the members area)
This indicator alone is worth the price of the Inner Circle!
Shown on a normal bar chart:
(Available for download in the members area)
The Valtos Transition and U-Turn cost almost as much as the price of the Inner Circle.

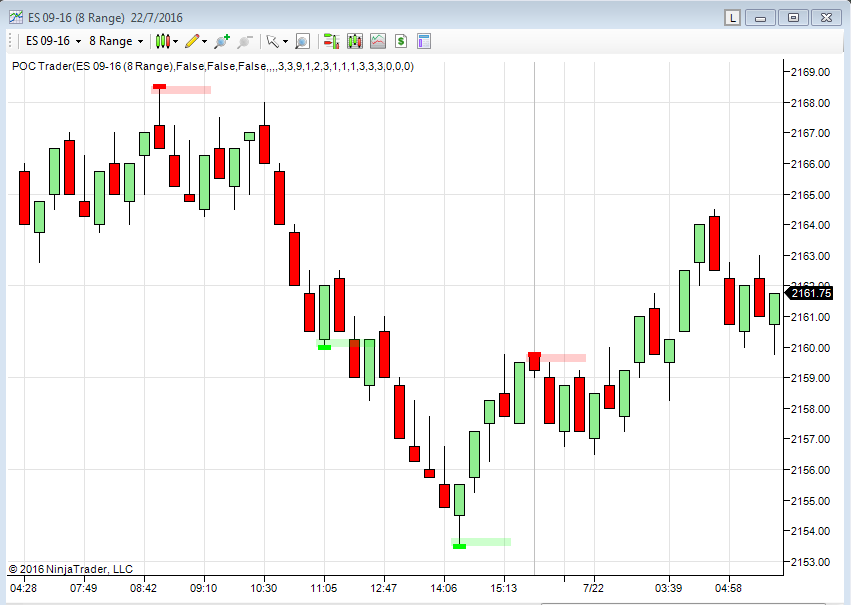
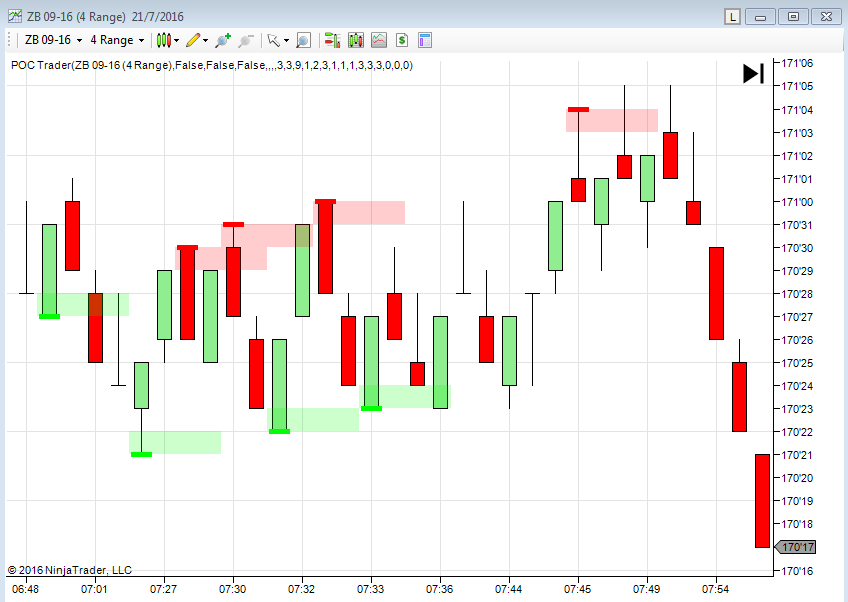
Webinar 1 – POC
POC is an overlooked tool by many traders, but it reveals a lot about the market. Look for POC at certain locations at extremes of bars when a move has been made.
If longer term money is involved in a move then it is probably more serious and you will see POC migrating up in a move up as POC acts as support or POC migrating lower in a move down as POC acts as resistance.
This wave like action, with the POC moving up and up is often a sign of institutional activity.
Webinar 2 – Combining POC
How to using POC Trader to find better, more profitable trades. When you use POC Trader as a filter, or trigger, in combination with order flow you can get rid of bad trades. That is what you want to do as a trader is cut out the losing trades altogether.
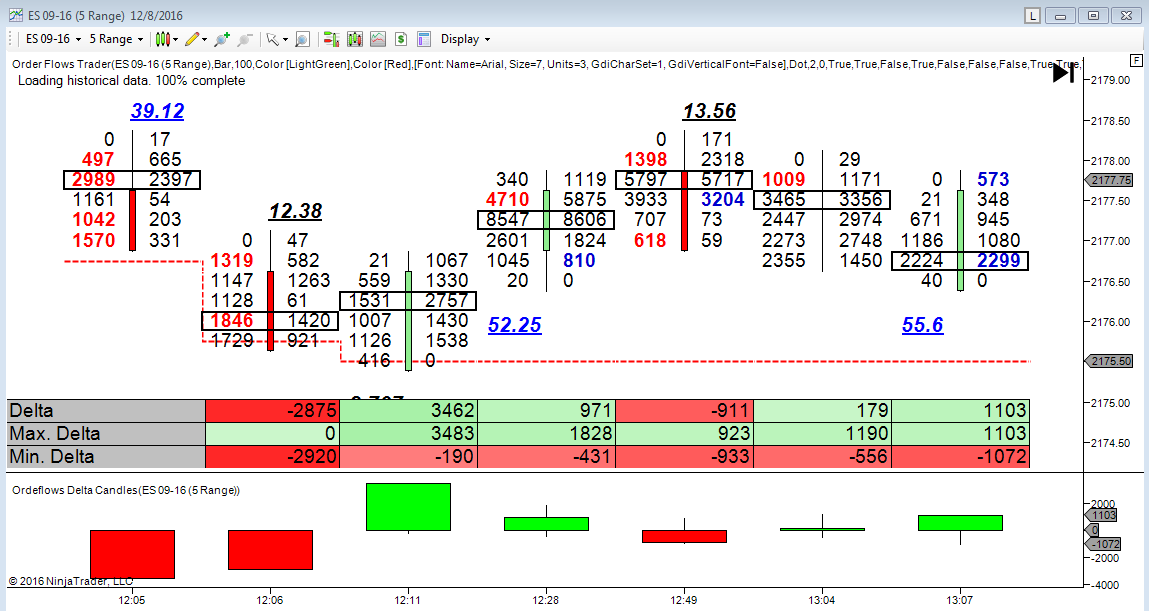
Webinar 3 – Delta Analysis
The best kept secret of order flow trading. Very few traders understand how to use delta analysis in their trading. I know a handful of very successful traders relying on order flow delta as the cornerstone of their trading methodology.
I do several webinars digging deeper into delta so that you can get a better more solid understand of delta and how to apply it to your own style of trading.
Webinar 4 – Intra-bar Delta
Catching Internal Shifts In A Bar As They Happen. If there was just one aspect of order flow that you can use to improve your trading use delta. I am a big user of delta. In this presentation I explain the importance of Max Delta and Min Delta which not many people use or understand.
Delta is not a holy grail, but a very useful and effective tool in trading and with it you will be able to make much better trading decisions.
Webinar 5 – Running Delta
Running Delta - Identifying Waves Of Aggressive Activity. Buying and selling often comes in waves and if you can identify when it happens you can often find good trading opportunities as it can be the start of a move. They always say do what the big traders do, but they don't tell you how to see what the big traders are doing, by reading the "Running Delta" you can.
I find myself being opportunistic at times and applying the running delta idea I can easily identify areas for low risk trades. Will every trade be a winner? Of course not. But what you want to find is areas where you can have low risk entries with good upside potential.
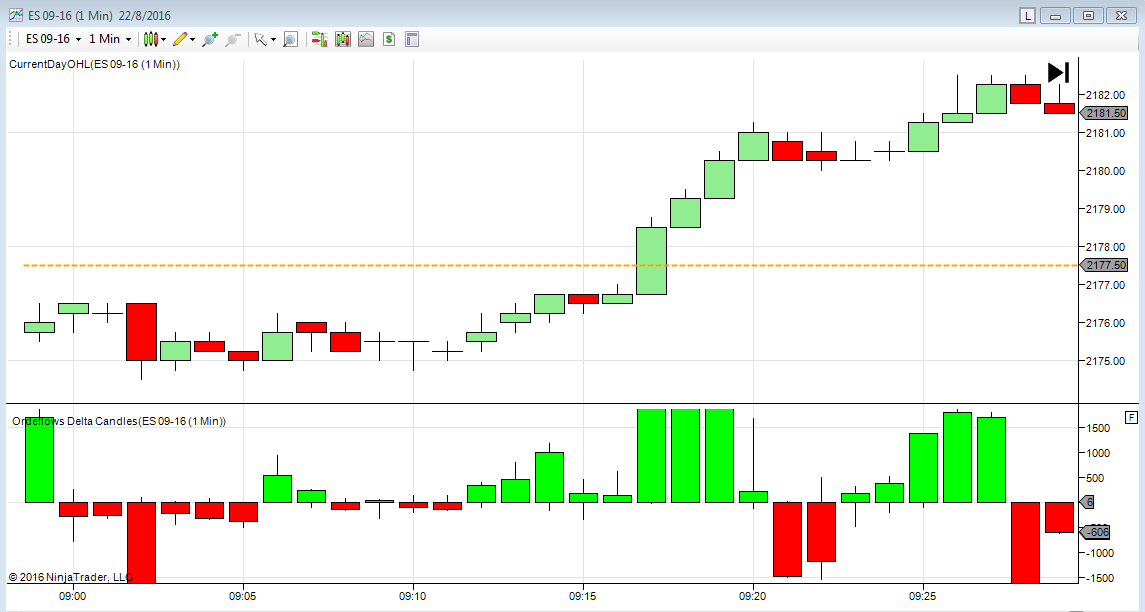
Webinar 6 – Delta Candles
Delta Candles are bar delta transformed into Japanese Candlestick style bar. So instead of having to analyse a number, the delta number, a trader can visually see what is happening in the delta based on candlestick. It’s a different way to view delta.
If you have any experience with Japanese Candlestick analysis you know there are certain candles and candle formations that you look for during the course of trading. Delta Candles are similar in that respect. You are looking for certain candles and candle formations to appear.
One of the key elements of candlestick trading that make them useful in warning of potential reversals is the occurrence of long wicks. Long wicks suggest price rejection and a potential failure of the market to continue in the same direction. When used with order flow, these candlestick patterns can be extremely effective signals.
Webinar 7 – Unfinished Business
When there is volume on the bid side and offer side at the extreme of a bar, that is called unfinished business. There are different reasons why unfinished business may occur. But the common consensus is that the price level should be revisited. I am not a fan of unfinished business and in this presentation I explain why.
Webinar 8 – Major Imbalances
A Major Imbalance is an imbalance occurring at a very high percentage, for example 1000%, as opposed to the more common, almost industry standard, 400%.
Major Imbalances highlight to you what the major players are doing or who is in control of the market, you can miss the next move or get caught on the wrong side of the market. Order flow, through major imbalances, reveal the big player’s activity, and therefore, their commitment in the market. Because large players cannot execute size orders instantly at favourable prices, the order flow reveals their entry into the market and gives you time to trade accordingly. This telegraphed information gives you almost the same advantages possessed by the initiating player. This is a powerful advantage over most technical signals that are almost always two bars late.
Webinar 9 – Longer Durations
Traders tend to think that order flow analysis is only for short term charts. Like 1 minute, 3 range, 100 tick charts, etc. But its not. You can use 15 minute charts, 30 minutes charts. Personally I don't go beyond 30 minute charts. But it does need to be an intraday chart.
I look at the same things - stacked imbalances, ratios, delta, etc. This presentation will deal with stacked imbalanced on longer duration charts.
When a market generated level of support or resistance appears on a longer duration chart I tend to put a little more weight into it.
Webinar 10 – Hidden Aggression
Hidden aggression occurs what seems like out of nowhere. You are sitting there watching the market and then notice a big amount trade on the offer and sell off. Or the bid getting pounded and the market rallies. What is going on. Its what I call hidden aggression.
You never know when a big order is going to come across an institutional trader's desk. When a bank gets an order to buy 3000 ES. Or Chevron does a deal in the crude oil cash market and now has to hedge the equivalent of 1500 lots.
Once you know what to look for in the order flow, spotting hidden aggression becomes easier. But sometimes it is so obvious, so clear that the market is screaming at you that you feel like an idiot if you don't take the trade.
Webinar 11 – The Obvious
How often have you looked at a chart later in the day and think "I should have bought here, it was so obvious. Every trader needs to have a series of trades that they can go back look for on a daily basis, setups that work for them and suit their trading style.
There are many different ways to approach the market with order flow. I don't expect you to apply everything 100% the way I do. What I hope you do is take away what I explain and apply it to your own trading method.
Here are 4 setups that I look for on a daily basis on every chart I watch:
They are:
(revealed in video)
I call these setups The Obvious because when you look at the move afterwards you will say to yourself "It was so Obvious.
Webinar 12 - Zero Prints
In this presentation I discuss a phenomena that I have not shared with the trading public before. It is what I call Zero Prints. They often occur as the market is moving fast or when the market is just about to make a big move. Zero prints happen because a trader is often sweeping the market and getting his position on.
If you are not familiar with sweeping the market, it is the activity of a trader who buys through the offer or sells through the bid. Often when a big trader anticipates a big move soon they will sweep the market. It is not something that retails traders do.
There are two types of zero prints that I discuss.
Zero prints do not occur very often, but when they do they often lead to nice quick moves which as a trader you want. One of your trading goals should be to get in and out with your profit as fast as possible.
Webinar 13 – Extreme POC
I have discussed the importance of POC before but I have been getting questions regarding what I mean by Extreme POC so I have devoted this entire presentation to explain it and answer your questions.
An Extreme POC is a reversal signal. It is stopping volume in the market. It can come after a move or it can come off a bounce.
Not every trader will get value of Extreme POC, if you are a short term trader you will find it a great tool to add to your trading tool box. If you are a longer term (over 5 minute chart) trader then you will not get very many signals. If you are trading a 3, 4 or 5 range chart or a 1 minute chart trader then you will want to seriously consider it in your trading.
Webinar 14 – The Flip Part 1
This is the first presentation about The Flip indicator. Honestly, I don't talk about the indicator much actually, what I talk about is the guy known as The Flipper, Paul Rotter and then I discuss about spoofing in the market and how it is done. It is illegal but I do think it is done in some form. Anytime there is money to be made, there will always be that element of society that will try and skirt the rules.
But the point of the presentation is to give you a back ground on how orders affect the supply and demand structure of the market. Orders going into the order book only show a trader's intent, while actual trades show a traders commitment to the market.
In retrospect I probably should have titled this presentation - Spoofing.
Webinar 15 – The Flip Part 2
This is the second presentation about The Flip indicator which is available for download in the members area.
The Flip indicator measures acute changes in aggressive buyers/sellers through the final delta, max delta and min delta. It is designed to find the changes in direction that the market should continue in.
In the Orderflows flip what it looks for 4 distinct instances of market activity. Flip A and Flip B.
1. The market gets pushed down with extreme selling and then comes right back up with extreme buying. Flip A buying.
2. The market pops up with extreme buying and then comes right back down with extreme selling. Flip A selling.
3. The market gets pushed down with extreme selling, pauses and then comes right back up with extreme buying. Flip B buying.
4. The market pops up with extreme buying, pauses and then comes right back down with extreme selling. Flip B selling.
I treat signals for Flip A and Flip B the same.
Webinar 16 – The Flip Part 3
In this follow up presentation I discuss more about the settings and what they mean and how you can experiment with them in you were to.
There are more examples in this presentation using candlestick and bar charts.
Also I have uploaded a cheat sheet, which is something you should read regarding this indicator. I discuss my settings for CL, YM, FDAX, ZB, ES contracts and show the YM in actual trading when used with the POC trader on extremes.
Webinar 17 – Absorption
Absorption, what it is, how to recognize it and how to trade it.
If you turn on the TV you hear pundits saying the market is in "consolidation" but they never say "the market is in absorption". Why not? I would venture to guess that those paid speaking heads don't understand the true nature of the market.
Absorption and consolidation are similar in that price movements are limited, but there is a big difference in the way they are formed, absorption occurs with normal volume, consolidation often occurs in areas with little trading occurring.
When absorption occurs you want to be able to recognize it and potentially trade it as we come out of absorption. In order to do that you need to look for signs that we are coming out of absorption and in this presentation I will show you how to do that.
Webinar 18 – Bar Delta Divergence
Bar Delta Divergence occurs when the price action of a bar and the delta are going in opposite directions. This often leads to quick moves with decent profit potential.
Generally the price action of a bar and the delta go in the same direction, however there are instances when they go in opposite directions.
Bar Delta Divergence differs from standard Order Flow delta which is negative delta at a new/equal high or positive delta at a new/equal low. Instead Bar Delta Divergence is a red candle with positive delta or a green bar with negative delta. In short go in the direction of the candle. If it is a red candle look to trade from the short side. If it is a green candle look to trade from the long side.
Webinar 19 - 2nd Slot Imbalances
2nd slot imbalances occur when traders are late getting into a move and either look for a bounce to get back in or just late to get into the move.
It is good for a short term trade signal, definitely not something I would be looking to hold all day. Think of it as a an extra tool in your trading toolbox and when you see it, take advantage of it.
Webinar 20 – Valtos Transition
My newest indicator - The Valtos Transition.
What The Valtos Transition does is it looks for the areas when the market is transiting from supply driven to demand driven (a down move that changes to become an up move) or demand driven to supply driven (an up move that changes into a down move).
I have said this many, many times – markets do not move based on mathematical formulas. What I mean is markets don’t move because an oscillator crossed the zero line. Markets move based on supply and demand and how can you determine supply and demand? Look at what is trading.
Webinar 21 – Aligned POC
Aligned POC is market generated support / resistance level.
What I like about Aligned POC is 2 things: 1) Not many traders use POC in their analysis so it gives you an edge with information that is useful. Who wouldn't want to trade with information that is available but not everyone is using? 2) It is a market generated support/resistance level which just happened and is probably not yet visible to every one else.
Think of Aligned POC like running. You run a few km then stop to catch your breath, while you decide to either turn around and go home or continue on in that direction.
Webinar 22 – Hidden Gaps
Hidden gaps occur during the trading day that are not immediately visible to the trading public because they are limited to their charting software. Order flow foot print charts allow you to see the areas where price moved through quickly.
Hidden gaps occur often in the normal course of trading and has significance in terms of price direction, reversal or momentum.
I use the term Hidden Gaps even though there may be some small trades at a level. It is not a True Gap in the purest sense of Gap analysis. When I get into the examples you will understand what I mean.
Generally, Hidden Gaps are emotionally driven events that occur largely because a big buyer (or seller) has come to the market to start buying up (selling) large quantities quickly.
Webinar 23 – Valtos U-Turn
The Valtos U-Turn is an indicator which reads the price action in the order flow and looks for the points where buyers or sellers have given up and the market has a tendency to reverse due to hidden supply or hidden demand.
What is hidden demand and hidden supply?
Hidden demand is high traded volume on the bid side.
Hidden supply is high traded volume on the offer side.
You hear the phrase "trapped traders" a lot these. Even though I think it is nothing more than a buzzword, there are instances when retail traders come to market late thinking it is going to go higher or lower only to run into hidden demand or hidden supply.
Webinar 24 – Trend Days
I discuss trend days and more importantly how to identify trend days early in the day so to position yourself on the right side of the market and not fight it.
You always hear "the trend is your friend." or "Go with the trend." But for most traders trying to identify when a trend is occurring is the difficult part.
I show you how to use Volume Profile, POC and value areas to determine if a trend is happening. The earlier you can identify a trend is about to happen, the more profit you can make.
Webinar 25 – Breakouts
I discuss Breakouts and how to order flow to confirm them.
Every time you start making new highs you should be asking yourself, will this market keep going higher? Will there be follow through and new highs made or is this high going to hold? Or if you are making new lows you should be asking the same question, will this low hold or are we going to keep on making new lows?
I used to be a breakout trader in my younger days. One of the major problems I had was knowing when a breakout would continue or fail. There is no worse feeling than buying the high of the day, someone has to do it. But the order flow can help give you clues that the market can keep going higher (or lower).
If you are just looking at a normal bar chart you won't know what is going on in the order flow and you will suffer as a result of it by buying into weak breakouts or selling into weak breakdowns.
Webinar 26 – Candlesticks
How I use order flow imbalances with candlestick analysis.
The problem with trading with candlestick analysis is when patterns work they work great, but there are times when they fail as well. Of course you never hear about the failures from candlestick traders, instead you only hear of the winning trades "oh man, it was a beautiful engulfing pattern right off the low and then we rallied straight up to the highs." Ok, well what about the times the engulfing patterns didn't work? Radio silence.
In my trading I have always found two candlestick patterns to be effective in my trading, whether it was Malaysian Palm Oil, Hang Seng or US 30-year bonds. The patterns are the shooting star and the hammer. But still there are times they failed. However if you apply order flow analysis to the candlestick analysis I found I was able to refine my trades and increase my win percentage as a result of eliminating the patterns that often failed.
Webinar 27 – Swing Trading
A decent portion of traders who want to learn order flow analysis come from a swing trading background. Swing traders trade around swing highs and swing lows which are essentially pivot levels.
When you have your own levels defined, levels that you are watching in the market and you see something in the order flow that is also confirming that level then you have a very powerful potential trading opportunity.
In this presentation I show how to combine swing levels with stacked imbalances in the order flow to find higher percentage trades. By combining these two methods of trading you can get out of potentially losing trades much earlier and in some cases even pass on trading some stacked imbalances altogether. But the times when a stacked imbalance is confirmed with a swing level or pivot you often have a highly successful trade on your hands.
Webinar 28 – Negative Development
Negative Development which is best described as market activity that is opposite of what is expected.
A very important aspect of trading that most traders fail to realize is what happens after you get into a trade. For a trade to move in your direction you need more traders coming into the market to push the market in your direction. Otherwise you can have the best system or best entry in the history of trading, but if there isn't that follow through your trade won't be successful.
One of the beautiful aspects of order flow is being able to pick up what is happening in the market. I have kids and one of their toys is a puzzle with a round peg, a square peg, a triangle and a star and each one goes into a particular slot. When you have the round peg you put it in the round hole. But there are times when you are holding the square peg and try to put it in the round hole you have a problem. You have to adjust and turn the puzzle to find the square hole. Market conditions change and you have to be able to adjust. You need to realize when you are holding the round peg but looking at the triangle hole. Traders that fail, don't realize they needed to adjust their thinking.
If you are familiar with Market Profile you have probably heard the term "Minus Development" which is a bit different and I explain it in the presentation.
Webinar 29 – Discipline
What do you think the hardest part of trading is? Most people think the hardest thing about trading is the learning curve. But trading can be learned. I think the hardest thing about trading is something that can’t be taught, it is something that you either have or don’t have. We all have it to some degree and it is something that must be nurtured and developed and it is called discipline.
Discipline is something that traders have varying degrees of. It is an intangible. You can discipline yourself not to smoke or drink 1 beer when you go, but can you develop enough discipline to give a trade a chance to work out? Do you have discipline to take a loss?
This presentation I don't discuss any trade setups, instead I focus on the psychological aspect of trading which is something just as important as a good trade setup.
Webinar 30 – Size Traders
I discuss how to look for the size traders in the order flow. Everyone says follow the big money as if it is easy to see decifer what they are doing. Most of the time you can't tell when the big traders are active. But once in a while they leave clues that stick out like a sore thumb.
A problem I have when people say to follow the big money is how do you know if a big trade is getting into the market our liquidating a position? There is a huge difference.
Following the big money really matters in the short term or the extremely long term. In the short term you are concerned with the next few ticks to the next 30 minutes. In the long term you may be looking at weeks in position.
This video helps you to understand the pros and cons of "following the big money."
Webinar 31 - Stops
The first book you ever picked up on traded told you that you must use stops.
While that is true, what they don't tell you is how to properly place your stops.
Every trader has their own way of placing stops, but some make no sense.
Where should you place your stop? Its simple. You place it where the reason for being in the trade is no longer there.
A lot of traders place their stops too far away and that just eats their profits.
You want to keep your losses small, but to do that you need to keep your stop close.
If you stop is too close you can get stopped out too often, which is counter productive.
In this video I show you how you should approach your stop placement. You might be placing your stops too far away and not realize it.
Webinar 32 - Ratio Bounds Low
In this presentation I discuss ratio bounds low. It is the first part of a 4-part series on using order flow ratios in your trading.
Ratio bounds low is what I consider stopping volume or support in the market. It indicates heavy volume at the bottom of green candles (up bars) or at the top of red candles (down bars).
Take it in context of the market. You want to see ratio bounds low at the end of moves.
Think of it as resistance or support.
Webinar 33 - Ratio Bounds High
In this presentation I discuss ratio bounds high. It is the second part of a 4-part series on using order flow ratios in your trading.
Ratio bounds high indicate price rejection. Small volume at tops of down (red candles) bars or bottom of up (green candles) bars.
As prices move higher buying decreases until the last buyer(s) have finished buying. Or as a market moves lower the market keeps going lower until the last seller(s) have finished selling. Then the market turns.
Now keep in mind the market turns on different factors, it could be buying or selling has dried up which is price rejection. Or the market can be rallying until a big seller comes in with a lot of supply to sell which squash the buying and then the buyers become sellers.
Webinar 34 - Bollinger Bands
In this presentation I discuss combining ratios with Bollinger Bands. It is the third part of a 4-part series on using order flow ratios in your trading.
Trading bands, whether they are Bollinger Bands or any other type of trading bands, are lines plotted in and around the price structure to form an envelope. The price action near the edges of the bands are what traders are interested in. Its not a new concept, but it is one of the most powerful concepts for traders.
Trading bands together with order flow can confirm price action which ultimately will help you refine your trading opportunities.
Bollinger bands also give you price targets as one of the ways traders use bollinger bands is to trade from one band to another.
Webinar 35 - Divergences With Ratios
In this presentation I discuss combining ratios with order flow divergences. It is the fourth part of a 4-part series on using order flow ratios in your trading.
A divergence occurs when price and an indicator give you different signals.
In an up move, with green candles you expect positive delta and at a high you expect positive delta. But one of the first signs a market might move down from a high is the appearance of negative delta.
In a down move, with red candles you expect negative delta and at low you expect negative delta (for the market to go lower). But one of the first signs that a market may start to rally off that low is the appearance of positive delta.
Just because there is a divergence it doesn’t mean the market will rally from a low or sell off from a high. Sometimes it will, sometimes it won’t. But when you add in another part of order flow, ratio bounds high or ratio bounds low, you get better trading opportunities in the form of less losing divergence trades.
Webinar 36 - Seeing Double
hen the market retests a high or low watch the volume that is traded the second time around. If there is less volume the second time you test the level it often leads to a profitable trading opportunity.
Traders are always trying to take out previous highs and lows, but when they can't sustain the buying or selling the market often moves in the other direction and sometimes quite quickly.
I show you how I approach double tops and bottoms and specifically what to look for.
Webinar 37 - Rounding
Rounding is a unique order flow phenomena based on delta.
It describes the way a market makes a top or bottom and often precedes explosive moves.
I always say delta is one of the most underutilized pieces of market information. But delta is
central to understanding rounding tops and rounding bottoms.
When a market is rallying I am always on the lookout for a reason to sell if something appears in the order flow. I am not always blindly looking to sell, but when the market is telling me the buying on the way up is getting weaker and that selling is taking over. The same would be said on a move lower. I would be looking for signs that the selling is getting weaker and in the case of a market going lower I would then look for a sign that buying is now in control.
Webinar 38 - POC Framing
POC Framing descibes the consecutive migration of bar POC higher off a low or lower off a high and often signals the start of a strong trend.
Strong up trends need strong buying to come in and help move the market higher just as strong trends lower need strong selling to come in and help move the market lower. When bar POC's are migrating higher or lower along with price you can often get on board of trends early when they are starting.
Bar POC is an important piece of the order flow puzzle that once you understand how to use it will help make your trading more consistent.
Webinar 39 - References
What are references? Levels to trade around. They are levels that hold information.
Why are references important? You need to put the market in a structural format. Meaning you have to decide if the market is above value, below value, over priced, under priced, etc. Without references what are you going to base you view of the market structure on?
References are market generated information at its finest. They are areas where moves ended and markets reversed.
When you combine market generated information with order flow analysis you tend to take better trades instead of fighting against what the market is telling you.
Without references it would be like flying an airplane and not knowing where the ground was, where the mountains are, if there is a storm approaching.
Traders fail when they don’t have anything to trade around.
Webinar 40 - Delta Extremes
Delta Extremes are recent bursts in delta.
When they occur they often signal the beginning of a strong move as either buyers or sellers are starting to come in strongly to the market.
Remember that delta is the net difference between aggressive buyers versus sellers.
Webinar 41 - POC Migration
While similiar to POC Framing, POC Migration can help you find market turning points and starts of trends a little quicker off the turn.
Bar POC is key with POC Migration. Have you ever wondered why a bar will pull back exactly to the previous bar's POC? That is where the volume was, that is where value was and now the market is moving on from that value area and looking for a new value area to build upon.
Webinar 42 - Delta Scalper 2.0
I recently relaunched the Delta Scalper after we made an adjustment as to how the Delta Scalper reads the price action of the market. The previous version relied most on just analysing delta, which was fine, but once we added in an additional price action analysis to the tool, the results have been quite amazing.
In this presentation I discuss the "lookback" setting and how you can adjust it to weed out some of your losing trades. Also I discuss how to use the delta scalper with stacked imbalances and lastly I discuss a particular delta scalper setup that I find is a very high percentage setup.
Webinar 43 - Declining Volume
Declining volume often occurs at highs and lows. When aggressive buying volume declines on a move up the move up will usually end. When aggressive selling volume declines on a move down the move down will often end.
One of the benefits of using order flow analysis is that you are able to see the volume being traded and it will give you insight into what the market is really doing but more importantly gives you some actionable information to find trading opportunities.
Webinar 44 - Multiple Imbalances
Multiple Imbalances are similiar to stacked imbalances. However multiple imbalances are just as important as stacked imbalances.
Most order flow traders are trained to look only for stacked imbalances. A stacked imbalance comes when someone sweeps through the market. Multiple imbalances is a revealing look at imbalances in a bar.
Webinar 45 - Thin Prints
Thin Prints in an order flow bar are the result of a fast moving market. Usually the result of a big buyer or big seller coming into the market and buy up a one or 2 price levels or selling down 1 or 2 price levels. The beauty of it is it often occurs right ahead of a big move.
If you are looking for the next few ticks or you are looking for the beginning of a potential understanding Thin Prints will help your trading and get you positioned on the correct side of the market.
And more to come…
Go from a trading not to lose mindset to a trading to win mindset.
What would it be worth to you to learn something new that could potentially change the way you trade and make you a profitable trader?

$997
Additional indicators will be released over time. The weekly webinars will be held weekly and educational materials will be released on a regular basis.
I mean...a lot of people bark "you'd make money trading this with this and that" -- only to discover, it's not what you hoped it would be. I get it. A lot of trading vendors out there put out garbage. I think the reason for it is they just don't have trading experience to draw from so they just copy other trader's systems and try to repackage it into something to sell because they can't make money trading because they aren't traders themselves.
So here's my promise to you:
1) No BS
2) A thorough education in the markets and trading
3) Latest Orderflows Trading indicators
You have to ask yourself what do you want out of trading? Do you want to treat it as a hobby or as a business? I cover a lot in the Inner Circle and some of the information may not apply to your style of trading. But if you are able to even just pick up one or two things and it transforms your trading into a consistently profitable business then the fee is worth it.
The choice is yours to take action today or try and figure things out by yourself and spend countless hours and money going down blind alleys and chasing windmills.
Please Note: Membership in the Orderflows Inner Circle does not include the Orderflows Trader Footprint Chart Software however as a member of the Inner Circle it is available at a discounted price, please email me for more info.
CFTC Rules 4.41:
Hypothetical or Simulated performance results have certain limitations, unlike an actual performance record, simulated results do not represent actual trading. Also, since the trades have not been executed, the results may have under-or-over compensated for the impact, if any, of certain market factors, such as lack of liquidity. Simulated trading programs in general are also subject to the fact that they are designed with the benefit of hindsight. No representation is being made that any account will or is likely to achieve profit or losses similar to those shown.
Disclaimer:
This presentation is for educational and informational purposes only and should not be considered a solicitation to buy or sell a futures contract or make any other type of investment decision. Futures trading contains substantial risk and is not for every investor. An investor could potentially lose all or more than the initial investment. Risk capital is money that can be lost without jeopardizing ones financial security or life style. Only risk capital should be used for trading and only those with sufficient risk capital should consider trading. Past performance is not necessarily indicative of future results.
Risk Disclosure:
Futures and forex trading contains substantial risk and is not for every investor. An investor could potentially lose all or more than the initial investment. Risk capital is money that can be lost without jeopardizing ones’ financial security or life style. Only risk capital should be used for trading and only those with sufficient risk capital should consider trading. Past performance is not necessarily indicative of future results.
Hypothetical Performance Disclosure:
Hypothetical performance results have many inherent limitations, some of which are described below. no representation is being made that any account will or is likely to achieve profits or losses similar to those shown; in fact, there are frequently sharp differences between hypothetical performance results and the actual results subsequently achieved by any particular trading program. One of the limitations of hypothetical performance results is that they are generally prepared with the benefit of hindsight. In addition, hypothetical trading does not involve financial risk, and no hypothetical trading record can completely account for the impact of financial risk of actual trading. for example, the ability to withstand losses or to adhere to a particular trading program in spite of trading losses are material points which can also adversely affect actual trading results. There are numerous other factors related to the markets in general or to the implementation of any specific trading program which cannot be fully accounted for in the preparation of hypothetical performance results and all which can adversely affect trading results.
