
Understanding Market Participants In Order Flow
Understanding aggressive buyers and aggressive sellers in relation to big passive buyers and big passive seller.
When you have aggressive sellers they are selling into passive buyers. When you have aggressive buyers they buy from passive sellers. By definition, aggressive sellers sell into the bid, occasionally there will be bids that are big enough to absorb all the aggressive selling. The same is true with aggressive buyers, sometimes there is a big passive offer that the market can’t get through. That is when I would consider it a strong passive bid or offer. However you have to determine what is strong passive buying. It is important to watch if the market can through the levels of big passive bids or offers. When there are aggressive buyers and sellers but they can’t move the market in their direction it is important. That is not to say that those levels can hold all day long, sometimes they do sometimes they don’t. but for the immediate term, yes, i am looking for those levels to hold. You will see it happen in real time because the numbers stand out.
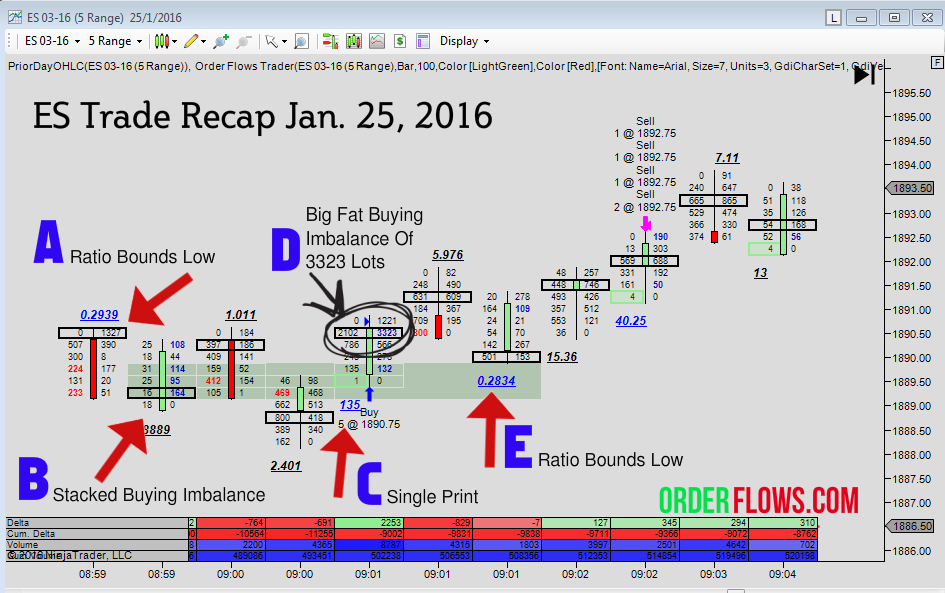
Here is a screen shot of a trade I took yesterday in the room. In the first bar at 8:59am there was a big passive offer at 1890.50. It traded 1327 contracts and sold off. The market made another run at that level and bounced off of it. I was looking at this as negative for the market, even though there was a stacked buying imbalance the fact that there was a big passive offer, kept me off getting long on that stacked buying imbalance. Then at 9:01 the market made another run at that 1890.50 level and there was a big buying imbalance of 3323 contracts which we finally broke through. So while you had aggressive buyers you were met with a very strong passive offer. The market popped up a little bit and came down to 1890.00 where there was a strong passive bid where it traded 501 contracts which was acting to support the market.
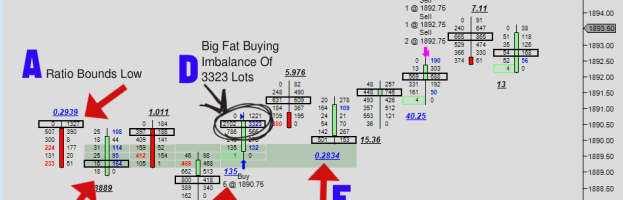
Point A) Ratio Bounds Low indicating stopping volume at that level. In this case it is at the top of a down bar which is bearish.
Point B) Stacked Buying Imbalance. A bullish signal. But I know I am looking at that Ratio Bounds Low in the previous bar. In the next bar 184 lots traded at that level of the Ratio Bounds Low and sold off.
Point C) Single Print. A bullish signal. But need confirmation to confirm it.
Point D) Big FAT buying imbalance of 3323 lots. This was the reason for getting into the trade.
Point E) Ratio Bounds Low on the bottom of the candle confirms that the move is up. Bullish signal.
The take away from this trade is this:
1) The market hit the stopping volume of 1327 contracts and reacted off it twice.
2) The third time the market went up there, the volume at that level got eaten up pretty fast causing the massive buying imbalance.
3) Once you get past that big passive offer the market didn’t have much resistance until later when more aggressive selling comes in to counter the stronger aggressive buyers.
While it looks like a lot of digest. It becomes second nature once you know what to look for. I created the Orderflows Trader software to be able to see more clearly what is occurring in the market and most importantly understand what is happening in real time so that you can trade off of it once it occurs.
As a trader you have to make a choice. Either keep doing what you are doing and buy all the rehashed garbage out there that gets you nowhere but broke and confused or make the choice to learn to trade with a proven method with real proof, and real results. Change starts right here from making a decision to learn order flow trading.