
Trade Recap Oct. 5, 2015 The Smack Down Trade
The Smack Down Trade
There comes a time when the market is just sort of drifting around for an hour or so and looks like it can’t make up its mind.
When you are a day trader that is probably the most frustrating type of market to trade because the market doesn’t want to go higher or lower, it just sits in a range. Grrrrrr.
Here is a trade I call the “Smack Down Trade.” It occurs when the market tries to go higher and when it does a seller comes in and “smacks it down.”
In this example in the US 30yr Bond Futures, ZBZ5. What is going on, the market sold off from 157-30 to 157-17 and rallied back up to 157-24. Then over the next 30 minutes the market drifted between 157-22 and 157-19.
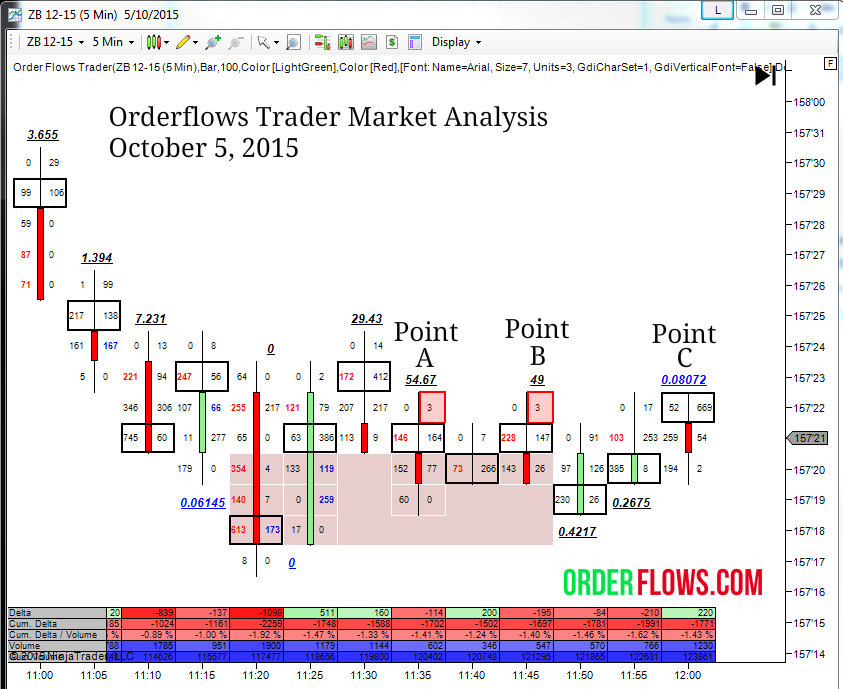
I like to play a game called “what do we know” when I look at a chart of the market before taking a trade. So what do we know about the market looking at this chart. What is the market telling me?
The market traded down to its low at 157-17 and just off the low there was a stacked selling imbalance zone between 157-18 and 157-20 which should be bearish if the market can stay below it. But what happened? The market rallied through it and was staying in it and above it for the most part. The market rallied up to 157-24, but over the next 30 minutes the market could not get above 157-22 while at the same time it couldn’t break below 157-19.
So where will the market go next? As a day trader your question is now where the market will go tomorrow or next week. You are constantly asking yourself where the market will go in the next 5 to 15 minutes and to answer that you have to listen to what the market is telling you. What is the market is showing you?
During this range there are 2 small prints and a lopsided high. Points A and B are the small prints where there is not much buying interest at 157-22. It traded 3 lots twice and sold off a few ticks. The market start to rally a little bit at traded 157-22 a third time, point C, on heavy volume, volume that hasn’t traded that much in a while – heavier than normal – and the market actually went bid there before someone came in and whacked it.
When you look at the individual bar it tells a lot.
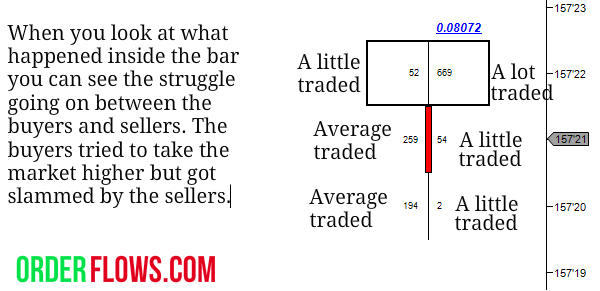
It is an interesting bar to say the least. The most volume in the bar occurred at the high 157-22 and it occurred on the offer. Once 157-22 started trading for size people started jumping in thinking the market was going to rally and it even went bid at 157-22. Then the market just dropped, but how it dropped is also important. Traders just cleared out the bids, you can tell that by the lack of buying on the offer.
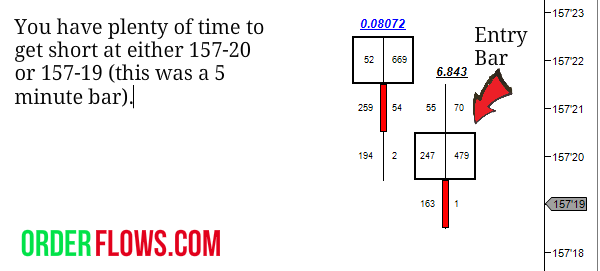
You have plenty of opportunity to get short between 157-21 and 157-19 during the next 5 minutes.
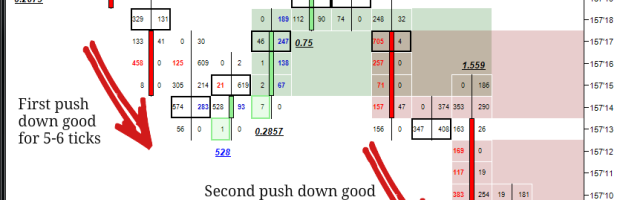
What happened next? The market sold off from 157-19 to 157-13 rallied back up to 157-20 before falling over again to 157-06 / 157-07.

Conservatively you would have pulled out 5 – 6 ticks. If you are a bit more aggressive you would have shot for 10-15 ticks.
You stop would be at 157-22 / 157-23 depending on you. So depending on where you get in at 157-19 or 157-20, you are looking at 2 or 3 ticks of risk with a conservative profit potential of 5 – 6 ticks or aggressive profit potential of 10-15 ticks. That’s a pretty good reward to risk ratio that anyone will be satisfied with.
I have been trading futures for 20 years, most of the time on an institutional level. That is the reason I know these setups work. When I was trading at JP Morgan I often had to get in and get out of positions in the mid to upper hundreds of lots and more often than not well over a thousand lots at a time. If I could buy 750 lots of ES in 2 or 3 ticks that was considered a good fill.
Some markets like ZN, the US 10yr bond, was easy because the size was there. You can buy 1500 without moving the market. However market depth and liquidity like that does not exist in most markets.
I created the Orderflows trader to show on the chart where institutional traders are getting into and out of the market. By learning how to think like an institutional trader then you can level the trading field.
If you are interested in learning more about how to make money with order flow you need to bookmark this website. I have written a 150 page trading manual on trading with order flow that is a companion for the Orderflows Trader software which I am currently offering for an introductory price of just $599.
Happy Trading.
Mike