
How Order Flow Delta Can Help Your Trading
How To Use Delta In Your Trading
Delta is an important part of order flow trading. Delta is the difference between the volume bought from the offer and the volume bought from the bid.
It will either be positive or negative and in rare coincidental instances it may even be zero. I say coincidental because it is often just luck that the delta finishes at 0.
So what is the importance of delta? Well, there are a few ways to interpret the delta. On a per bar basis it will tell you the strength of the buying or selling in a particular bar. If the delta is a big positive number it tells you aggressive buyers were in control of the bar. If the delta is a big negative number it tells you aggressive sellers were in control of the bar.
In an up market the aggressive buyers should be in control.
In a down market the aggressive sellers should be in control.
When a market turns from a demand driven market to a supply driven market the delta can show that to you as it is happening. In other words when a market is rally because of strong demand, once the demand starts to wane and supply takes over, the market sells off and prices drop.
When a market makes a bottom the opposite is true.
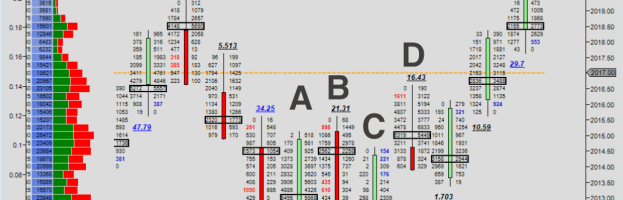
Here is an example. In this example we see a supply driven market turn into a demand driven market.
This chart is the ESM6 contract from March 17, 2016.
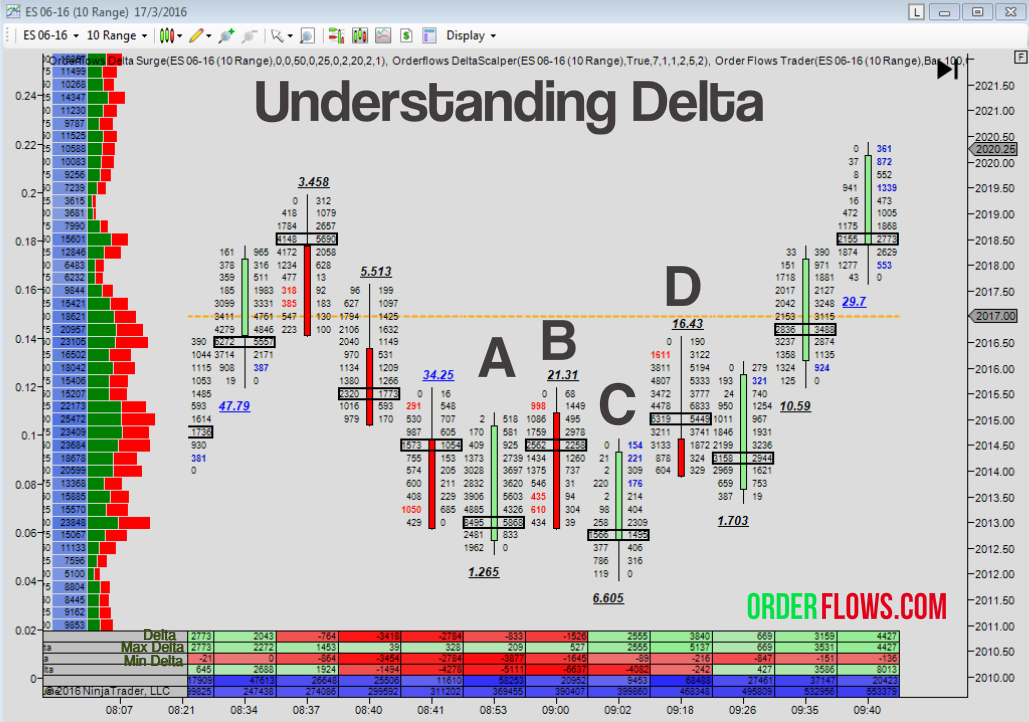
The ES was coming off a swing high at 2019.50 down to around 2013.00 You see 3 red candle sticks, all with negative delta. At the 8:53am bar (Bar A) there is still a negative delta, but the bar is green, so while the selling was happening early, some late buying came in. Note the delta is only -833.
It could be some profit taking, who knows. What I do see happing is there is a big amount traded on the bid side there at 2013.00. Volume of 8495. In fact look at the volume in the bar. It is quite chunky. There is obviously good buyers down at that level.
The market popped back up to 2015.50 (bar B) and then sold down to 2012.00 at 9:02am (bar C). What stands out in the bar at 9:02am is the big positive delta of 2555. That is a sign the market is finally ready to turn up – possibly.
If you are still not convinced you wait for the next bar for a confirmation sign (bar D). You get it in the form of strong positive delta of 3840. Even though the candle stick was red there was heavy aggressive buying of the offers early in the bar. That is a sign one expects to see when the market is going to go up, especially when a market has been hanging around a swing low.
Look for delta to become positive and the market to move away from the low. For a market to move higher aggressive buying needs to come, traders need to be lifting the offers. This will show up in the delta.
If you are just following a regular bar or candlestick chart you are not getting a complete picture of what is happening in the market.
What would you rather do? Look at a chart that isn’t giving you all the pieces to the trading puzzle or look at a chart that is screaming at you “hey idiot, demand is taking over from supply, don’t miss the move!”
There is more to delta than meets the eye. If you are not using it in your trading, you really owe it to yourself to start looking at it and understanding it.