Keeping Clean Charts For Trading Helps You Make Better Trading Decisions

There is a saying “A cluttered desk is a sign of genius.” Unfortunately when it comes to trade a cluttered chart is not a sign of genius. It is easy to want to throw up a bunch of indicators on your screen. It looks cool, but is it really helping you trade?
You have to learn what is important to your trading chart and only keep those items on your screen. Personally, I find that the more information on the chart the more confusing it gets. I only want to look at what is important to me.
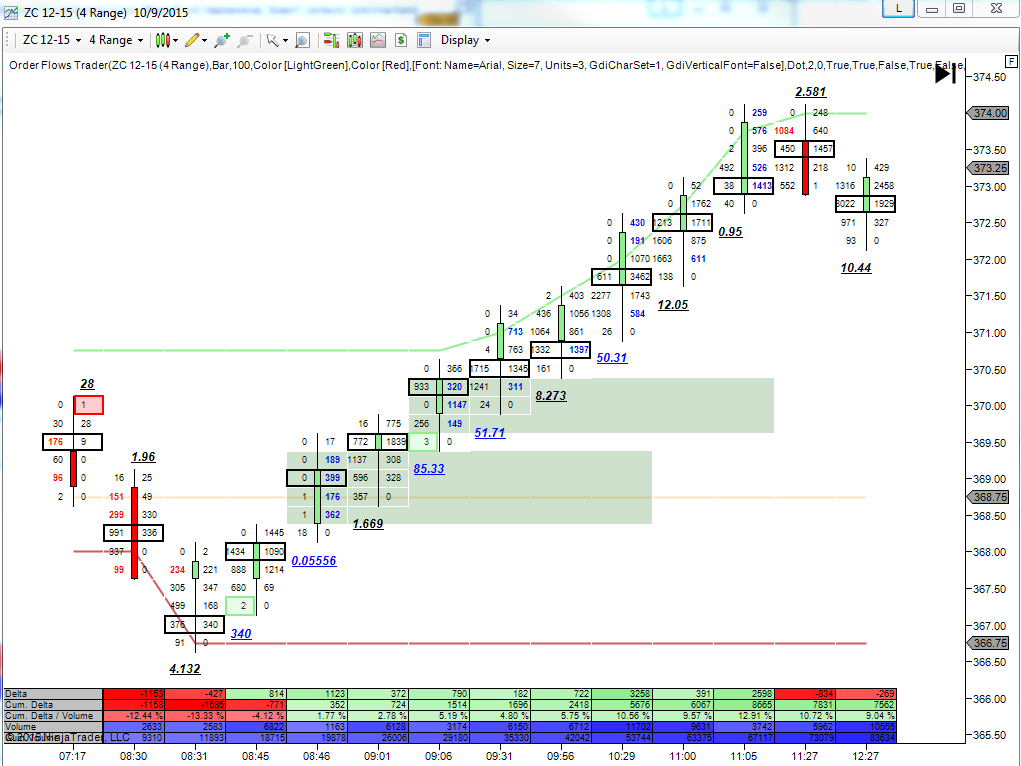
Here is an example of one of my charts. It is in the December-15 Corn futures.
Notice how clean I keep it. The only squiggly lines there are today’s Open, today’s high and todays low. I do look at other levels like yesterday’s high and low, the monthly high and low, yesterday’s value area highs and low. But I don’t need to have those lines necessarily drawn on my chart all day long. I have them noted and when the market trades to those levels I watch what happens but once we hit those levels it is not so important to me anymore.
Today’s high and low is important to me because those levels can change during the trading day.
All the information that originates from order flow that is important to me is on my Orderflows Trader chart. This information is being derived from what is happening in the market now. Support and resistance levels that are occurring because of intraday market activity is on my chart. Market imbalances are shown. I don’t keep my charts cluttered. I am watching price action, not indicators.
Although you see me take trades based on a setup that I was alerted to based on an “indicator”. I call it an indicator, but it is not really an indicator per se. I would trade the same way without the indicators and just do the calculations manually but having it appear on my screen helps me see things easily and quicker and allows me to watch multiple markets at the same time. My indicators act more like alerts which tell me to pay attention to what is happening in the market.
I have been a student of the markets even before I started working for a bank or trading firm. I cringe when I hear someone talking about using a 21 period EMA crossover of another EMA and when the RSI and MACD are doing this or that. It is almost like the more indicators they add to their screen the more confident they become. Instead what they are doing is just manipulating data to fit their story about the market – curve fitting. They are not gauging the market.
Wouldn’t it just be easier to learn how to understand what the market is doing and react to what is going on rather than just waiting for a perfect alignment of 20 different indicators?
Technology has really helped out the retail trader. 20 years ago having a real-time chart cost a few hundred dollars a month. Now the CME practically gives the data to you for free as long as you have a trading account. That is probably the best thing the CME has done to help retail traders.
There are a plethora of trading software packages you can buy that will put up all sorts of fancy indicators on your screen. Buy when the line is blue and sell when it is read. Simple right? Then when the system doesn’t work, the trader goes out and buys another indicator to use as a filter with his other indicator. So now you have 2 different indicators on your screen. This is where things start to get messy. Thinking that the more indicators you have giving you signals, just taking the ones that are aligned is the best way to go.
If you have ever walked into a prop trading firm, you see a lot of guys trading with only the DOM, no charts. This is about as clean a trading screen as you can get. They are just watching the order flow come into the market and watching the price action. This is a highly developed skill that not everyone can replicate. These are pure order flow traders just trying to scalp a few tick with every trade many times a day. I am not a good DOM trader, I know that, that is why I developed my own tools to help me trade the best way I know how, efficiently and informed.
How cluttered are your charts?
Happy Trading.


