
The 1 Tick Trade Setup
The 1 Tick Trade Setup With Order Flow
I love to talk to successful traders and hear what methods they use successfully. One of the most influential books in my trading life was Market Wizards by Jack Schwager. What I found most interesting is there you have 20 extremely successful traders and they each have their own way of trading. Add in Jack Schwager’s second book, The New Market Wizards, and you have another 20 or so traders all doing something different, yet very successful. The one thing they all stress is to have good money management and trade management
Good traders have good trade management and money management habits. Every trading book says the same thing “cut your losses short and let your winners run.” Stop placement is one of the most misunderstood and confusing parts of trading for most traders.
The best form of risk management is having an excellent trade entry with a stop where your opinion on the market is wrong.
The best way I have found to minimize risk is to take trades that have inherently low risk in them – 1 tick, 2ticks, 3 ticks– with upside potential of 10, 20 or more ticks. I keep the reward side open ended, I don’t try to pick a top or bottom, I just look to take a chunk out of the middle of a move. The reason I don’t have a target is because you will miss the one big move you may need. More importantly I am out quickly when I am wrong.
I know what you are thinking…something along the lines of the John Lennon song “Watching The Wheels”
People say I’m crazy doing what I’m doing,
Well they give me all kinds of warnings to save me from ruin,
When I say that I’m o.k. they look at me kind of strange,
But I am here to say yes you can trade using 1 tick stops if you are precise in your trade entry. Not only that I am also going to show you how to find trades with 1 tick stops.
Why is order flow so important? How can you understand the behaviour of other market participants when you have no idea where they are buying and selling in the market? Once you understand where they are trading and what side of the market they are on it is only then that you can make more accurate trade decisions. You don’t want to be buying at a level where institutions are likely to start selling, that will be like getting run over by a truck. Instead you want to be selling at the same level institutions are selling and buying where they are buying. When you do that it is like tailgating an ambulance on the way to the hospital, everyone gets out of your way.
How a market reacts off traded volume on the bid and offer determines where the market will go.
The key to analyzing supply and demand is that demand will eventually wane, while there is always supply. When buying has been satisfied, there is still supply in the market. This is the reason why prices go down faster than they go up. When you get in a moment when there is no reason to buy anymore, because all those buying have been satisfied, prices will fall.
It doesn’t matter if it is in crude oil, emini s&p, 10 yr notes, eurocurrency, corn, wheat – the reason is the same. I do tend to find that these setups work best in thick volume markets.
I cannot stress this enough but if you want to have success as a trader you have to understand the underlying reason the market is moving. Markets don’t move because of a moving average crossed over another moving average or an oscillator crossed the zero line. The market’s movement is what caused those technical events to happen. Prices move based on market conditions, not on technicals. Once you understand market conditions that cause the technicals to happen, like when price moves so that the moving averages could cross or an oscillator could cross the zero line, then you are on your way to being a profitable trader. You will ahead of the 95% of traders that lose money in the market. It’s those traders whose money you will taking. Imagine being able to know that price will move
As a trader you have to accept the fact that any given trade, no matter how juicy the setup looks, can fail.
Before I get to the examples, I want to preface this by saying that in order to see these trade setups you will need an order flow tool for your charts. There are many different order flow software in the market. The one I recommend is the one I created Orderflows Trader. I created Orderflows Trader so that I can see these setups as they happen because none of the other available software highlights these trade setups. Orderflows Trader runs on the NinjaTrader Trading Platform which is available for free as well as a paid version.
Ok, that said. Now let’s get to the heart of the matter and see how to find low risk trades with 1 tick stops.
The first trade setup occurs when there is a stacked buying imbalance zone or stacked selling imbalance zone.
Orderflows Trader will draw the zones on your chart so you can easily see them. Here is an example. You can adjust the zone color to whatever you prefer. I have mine set to green for a buy zone and red for a sell zone.
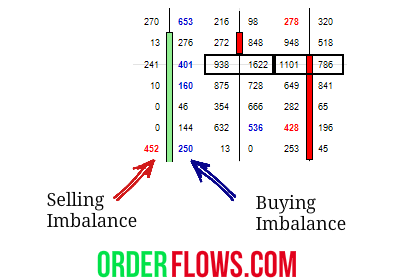
What is the logic behind this setup? We know that a buying imbalance occurs when the volume traded on the offer measured against the bid is greater than 300% (I use 300%, but you can use whatever % you want). Or a selling imbalance occurs when the volume traded on the bid is greater than the volume on the offer.
Orderflows Trader has another important setting, it is called the Imbalance Volume Threshold. What is it? It is the minimum volume requirement for an imbalance to occur. I set it to 90. It’s a tough decision, because the difference between 89 and 90 is only 1 tick and in reality you can probably take a trade. I prefer 90 because originally I was using 100 but realize that is kind of an arbitrary number and I don’t want to miss trades where the volume is still a good size at a minimum. The reason I created this minimum volume threshold is because when you have an imbalance but the volume is only 1 lot against 10 or say 0 against 9, that is just not enough volume traded to make it worth looking at. Remember you are interested where institutions are participating, they are not trading 10 lots, they are trading hundreds of lots at a time.
Why are these levels important? These levels are where there are aggressive participants showing their intentions in the market. It is often an institution that has an order to get filled at that level, that is why when it comes back to those levels it is not uncommon to see those same participants reappear in the market.
The settings for the volume imbalance can be found when you open the Indicator on NinjaTrader.
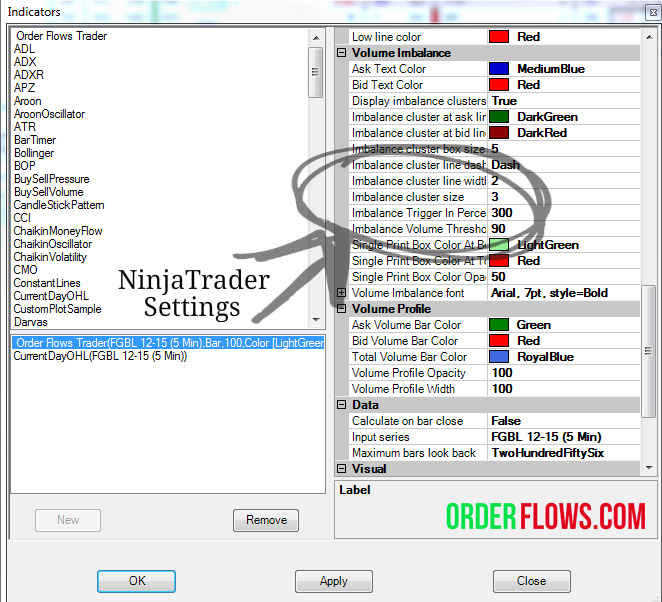
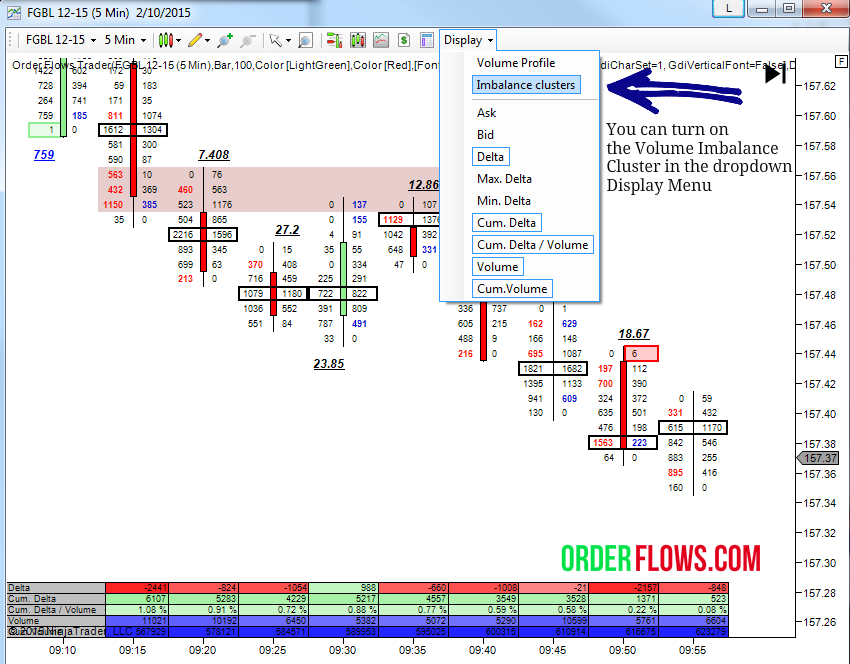
Make sure you have turned on the Imbalance Clusters on your Orderflows Trader. The easy way to do it is from the dropdown Display Menu.
Before going any further let me first talk about what kind of chart to use, minute chart, volume chart, range chart, etc.
I find minute charts work great for the 1 tick setups. You can play around to see if they work with other types of chart for your trading style. I use 5 minute charts for this setup as opposed to range charts because I am looking at volume distributed over a time period as opposed to volume distributed over a range of prices.
Let’s take a look at the Orderflows Trader charts to find 1 tick setups.
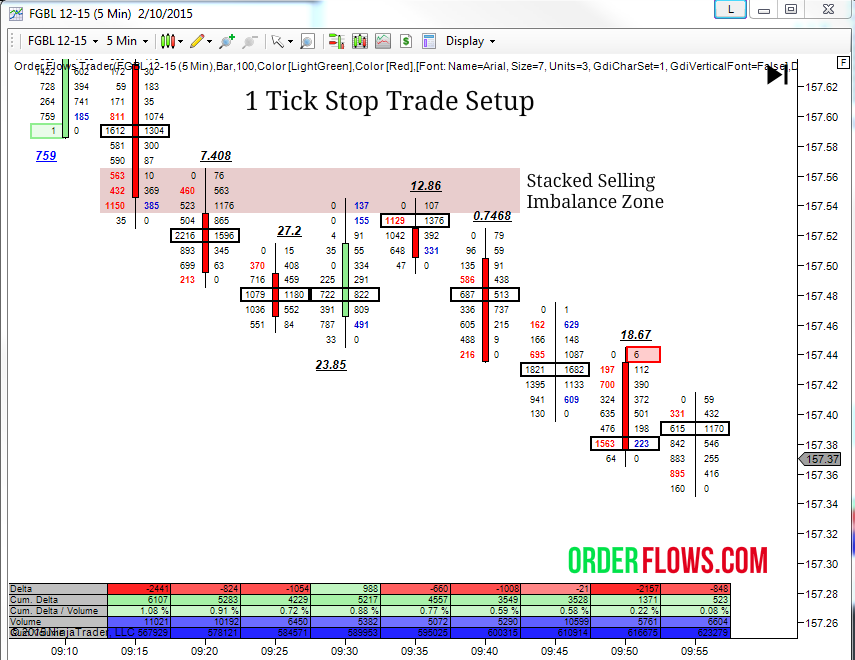
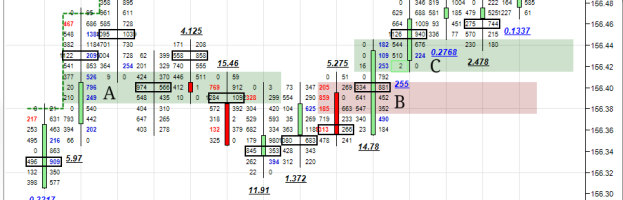
On this chart the Stacked Selling Imbalance Zone ranges from a high of 157.56 and a low of 157.54.
If it is a Stacked Selling Imbalance Zone you are looking to sell on rallies into the zone. If it is a Stacked Buying Imbalance Zone you are looking to buy on dips into the zone. Your stop goes 1 tick beyond the zone which will give you a 1 tick stop trade setup. You can also use a 2 tick stop by buying in the middle of the zone which will force you to use a 2 tick stop.
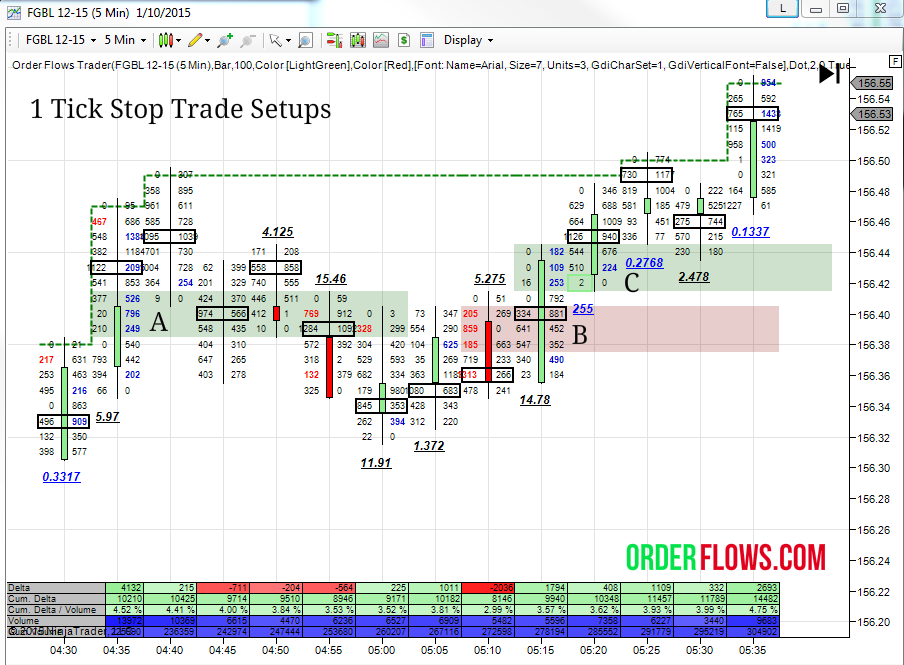
Point A – Stacked Buying Imbalance Zone between 156.41 and 156.39. You put a limit to buy at 156.39 with a stop at 156.38. The market came down into the zone. The stop was hit. So a loss.
Point B – Stacked Selling Imbalance Zone between 156.38 and 156.40. You put a limit to sell at 156.40 with a stop at 156.41. The market came up into the zone, but again the stop was hit. Another loss.
Pont C – Stacked Buying Imbalance Zone between 156.42 and 156.44. You put a limit to buy at 156.42 with a stop at 156.41. The market came into the zone and then the market rallied up. A winner? Even though the trade looks good only 2lots traded at the low of the zone and you wouldn’t have gotten filled.
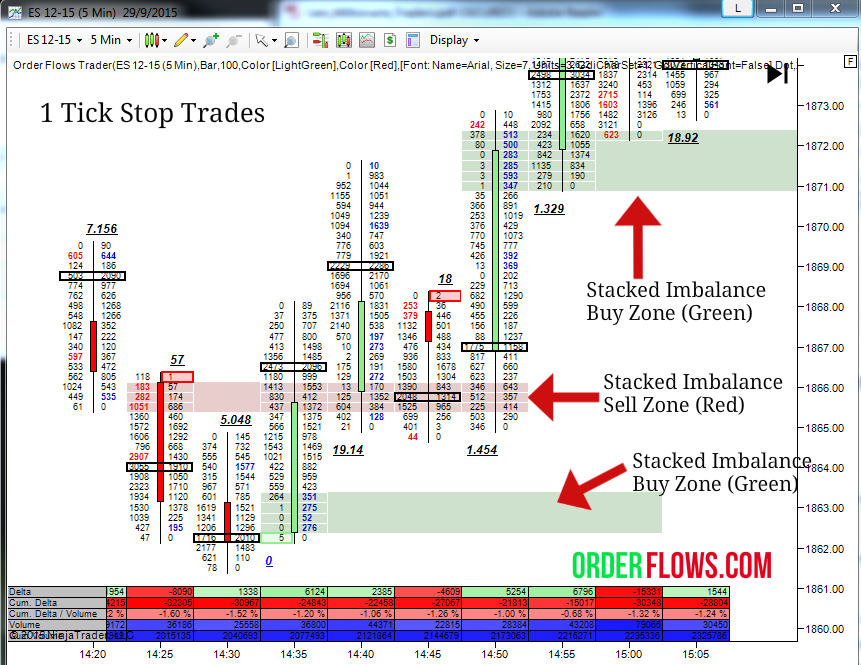
Let’s take a look at another chart at some setups.
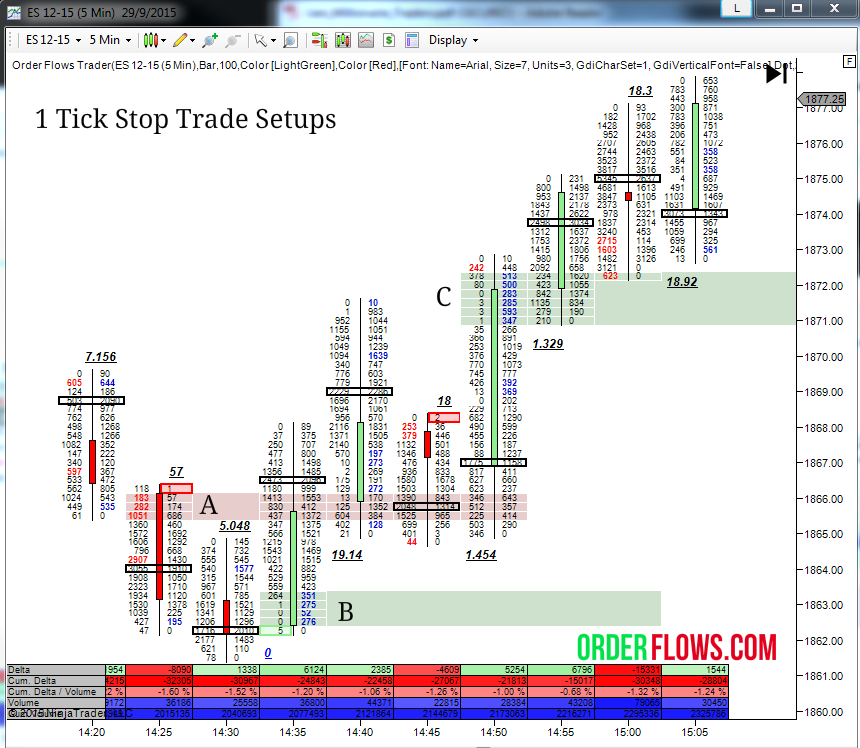
Point A – Stacked Selling Imbalance Zone between 1865.50 and 1866.00. You would put your sell limit order in at 1866.00 and stop at 1866.25. You would have been stopped out. A loss.
Point B – Stacked Buying Imbalance Zone between 1863.25 and 1862.50. The market never came back into this zone so there was no trade.
Point C – Stacked Buying Imbalance Zone between 1872.25 and 1871.00. You would put your limit in at 1871.00. The market came into the zone and rallied up to 1877.75 which is 27 ticks. I am not implying that you would have been able to buy at 1871.00. It is a queue system, first in first out. But you could have bought at 1871.75 there was plenty of size traded on the offer there if you needed to move your bid up, which brings us to the next point.
When you are trying to enter the market on a limit order there is a chance that you might not get filled. If you have ever traded with real money, not on a simulator, then you understand what I am talking about it. When the market trades your price but you are working a limit you always run the risk of being unable on your order.
I like to scale in to positions, so what I do is put limits in at the different levels in the zone because the price doesn’t always reach the extreme of the zones. It can go half way into the zone. I still keep my stop outside of the zone because that confirms that the setup has failed.
When you trade setups with 1 tick stops you aren’t going to be right every time. You will have losses. I don’t mind risking 1 tick to go for 20 ticks even if I am wrong half the time because the winners will take care of the losers.
The best way to manage risk is to take trades that have inherently low risk to being with.
I created Orderflows Trader to point out these trades to traders who are not used to looking at order flow. I have been trading with order flow for over 10 years, before there was even software to help track it! When I was working at Cargill I often had orders of thousands of lots of corn and wheat that needed to be filled every day without tipping my hand to the market. A lot of the principles I write about and have incorporated into the Orderflows Trader is built around how institutional traders, like I was, would have to tip toe around the market to move size.
Sometimes you have to force the issue in the market and be aggressive while other times you have to wait for the market to come to you.
If you are interested in learning more about how to make money with order flow you need to bookmark this website. I have written a 150 page trading manual on trading with order flow that is a companion for the Orderflows Trader software which I am currently offering for an introductory price of just $599.