Identify Market Structure With Volume Profile
Join me and Trader Dale who is an expert on volume profile as we dig deep into
volume profile and its practical trading applications.
Register here:
https://attendee.gotowebinar.com/register/514102351598005772
Volume Profile charts are visual images of data that are derived from actual market activity.
A profile can be created from the activity of any set time period or market session.
Generally speaking the longer the period, the more data becomes available, and as a
result the more visible the market structure and the easier it is to analyze the structure.
Understanding the day’s structure helps a trader see the market’s behavior.
Different types of activity in the market types of shapes and structures in the volume profile.
The volume profile shape reveals so much to a trader: if the market was trending or not, it
can idenitfy if the market is in balance or out of balance, if trading is initiative or responsive,
and most importantly, volume profile can easily identify key areas of support and resistance.
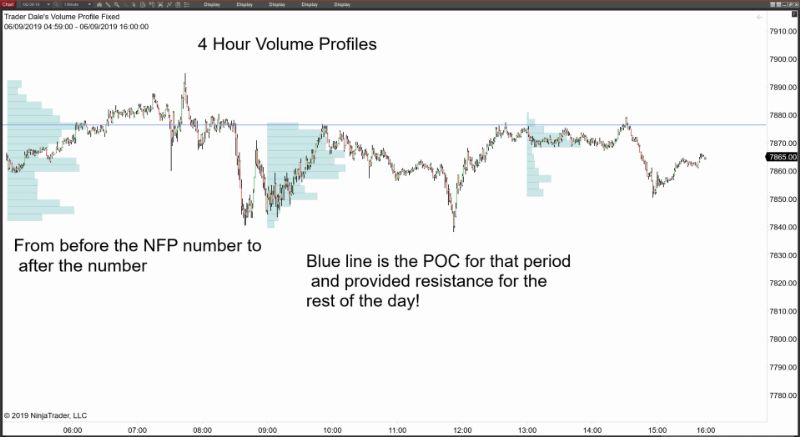
Here is a great example on how volume profile revealed a great resistance level in the NQU9 futures:

In this example, I am using a fixed 4 hour period volume profile. Yesterday was the release of NFP,
the unemployment number. The market is very volatile at the time, with a lot of volume going through
so I want to look at the period before and after the number comes out.
What stand out the most is the POC, the Point Of Control. The level with the most volume.
Notice how that level became the resistance for the rest of the session.
The profile shape is not a simple bell-curve, instead it is a triple distribution, which immediately
gives me levels to trade around, at least in the next time period.
With that information, you have an area to trade around.
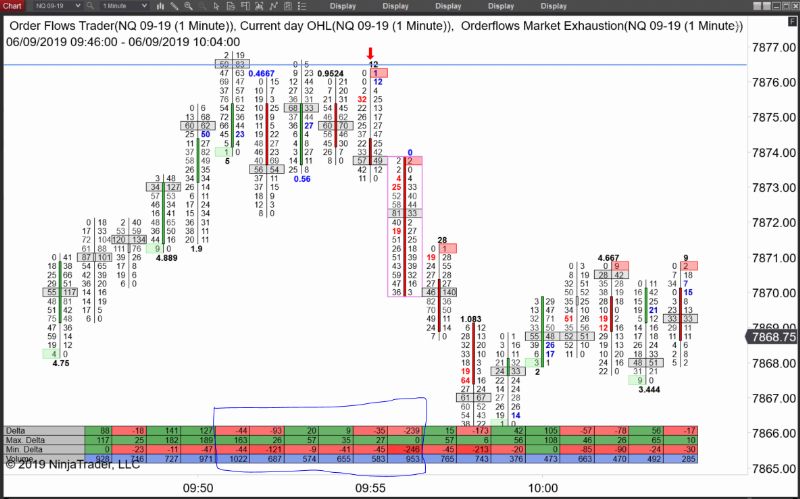
So let’s take a look at what was happening in the order flow:

As you come up to the level at 7876.50. Delta is weak and mostly negative!
Where are the buyers to take the market higher? They are not there.
As soon as you hit the level, you have negative delta of -44, -93, small positive delta of 20 and
small positive delta of 9, then negative delta of -35 and then boom, sellers dominate with negative
delta of -239.
There are also other bearish signs in the order flow such as small prints and multiple selling imbalances.
However, the delta was the clear sign.
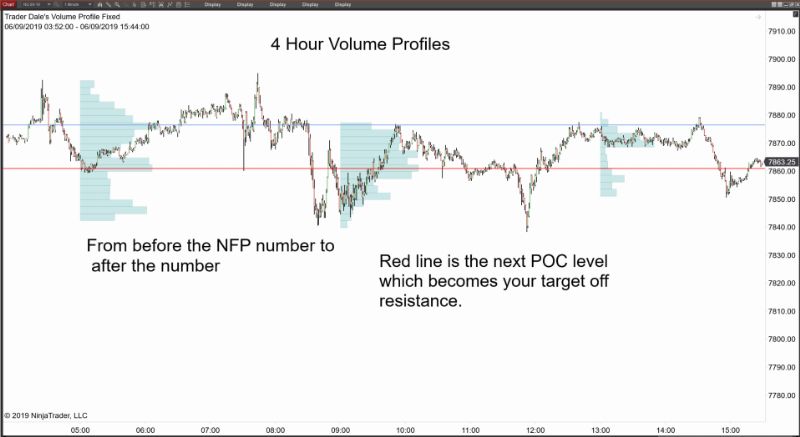
If you got short around the 7873-7875 area where is your target?
Just look at the volume profile. The next level that stands out is the red line at 7861.00
which is the 2nd POC, Point of Control.

Don’t make trading more complicated than it needs to be. Keep it simple.
Volume profile takes volume and puts it into an easy to read format so that
you can see market generated price levels.
This is just one of the ways to use volume profile, but actually there are many different ways.
If you want to learn more then be sure to join me and Trader-Dale on Tuesday Sept 10th at 4pm Chicago time
as we dig deep into volume profile.
Sign up here and we learn how you can use volume profile in your trading:
https://attendee.gotowebinar.com/register/514102351598005772


