
Orderflows Valtos Transition
The Valtos Transition shows the trader when the market is transitioning from a demand driven market to a supply driven market or from a supply driven market to a demand driven market.
Price is a measurement of what the current value is for any given commodity. It is universal and has meaning to participants. Markets move lower to attract buyers to step in and participate. Markets move up to attract sellers to step in and participate.
What happens during the trading day is often a reaction or adjustment that comes from market conditions happening on a longer timeframe. If you don’t understand that, let me clarify. Intraday moves on say a 5 minute chart are often caused by something happening on a longer timeframe.
This doesn’t mean that markets are going to trend in a direction all day.
Let’s say you are looking at a 5 minute chart, the market doesn’t move based on every 5 minute interval. Instead it moves based on what is happening on a macro level and as a day trader what you are trying to do is get in and get out on the moves as they occur.
So what you want to look for are the instances where an action from the higher time frame is visible on your shorter time frame.
You are not trading in a vacuum. Thinking that what you see on a 5 minute chart is because of a 5 minute chart. Its not. Its not everybody sitting around trading off the same 5 minute chart. What you are seeing on a 5 minute chart is trading off of all time frames.
When a market moves up it is due to demand driving the market.
When a market moves down it is due to supply driving the market.
What The Valtos Transition does is it looks for the areas when the market is transiting from supply driven to demand driven (a down move that changes to become an up move) or demand driven to supply driven (an up move that changes into a down move).
I have said this many, many times – markets do not move based on mathematical formulas. What I mean is markets don’t move because an oscillator crossed the zero line. Markets move based on supply and demand and how can you determine supply and demand? Look at what is trading.
The Valtos Transition was programmed to run on a normal bar chart as well as an Orderflows Trader chart. For sake of simplicity I will show examples on a normal bar chart.
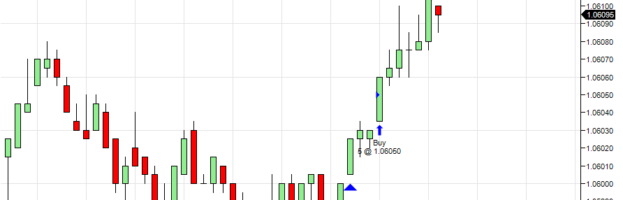
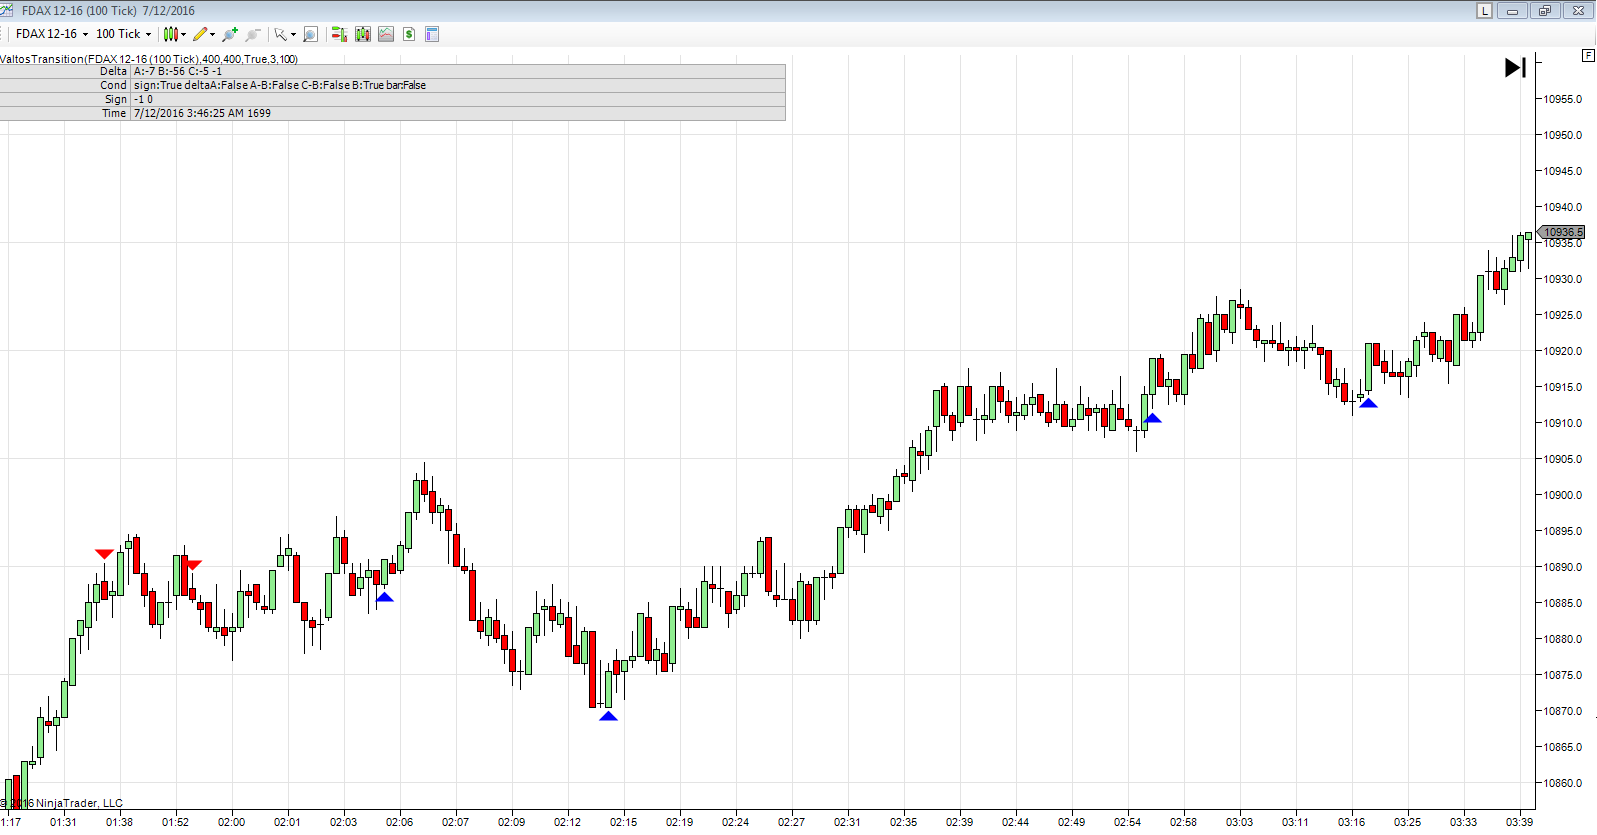
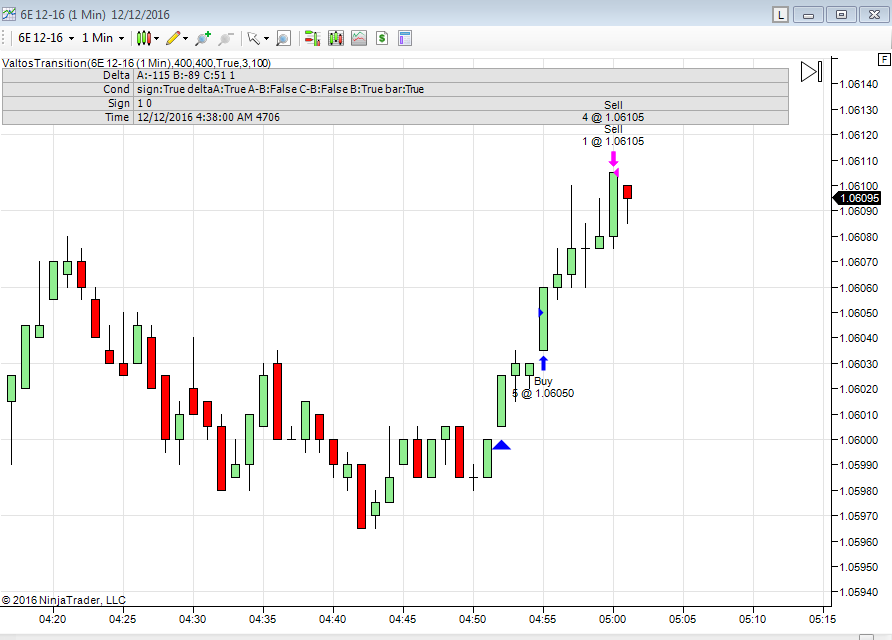
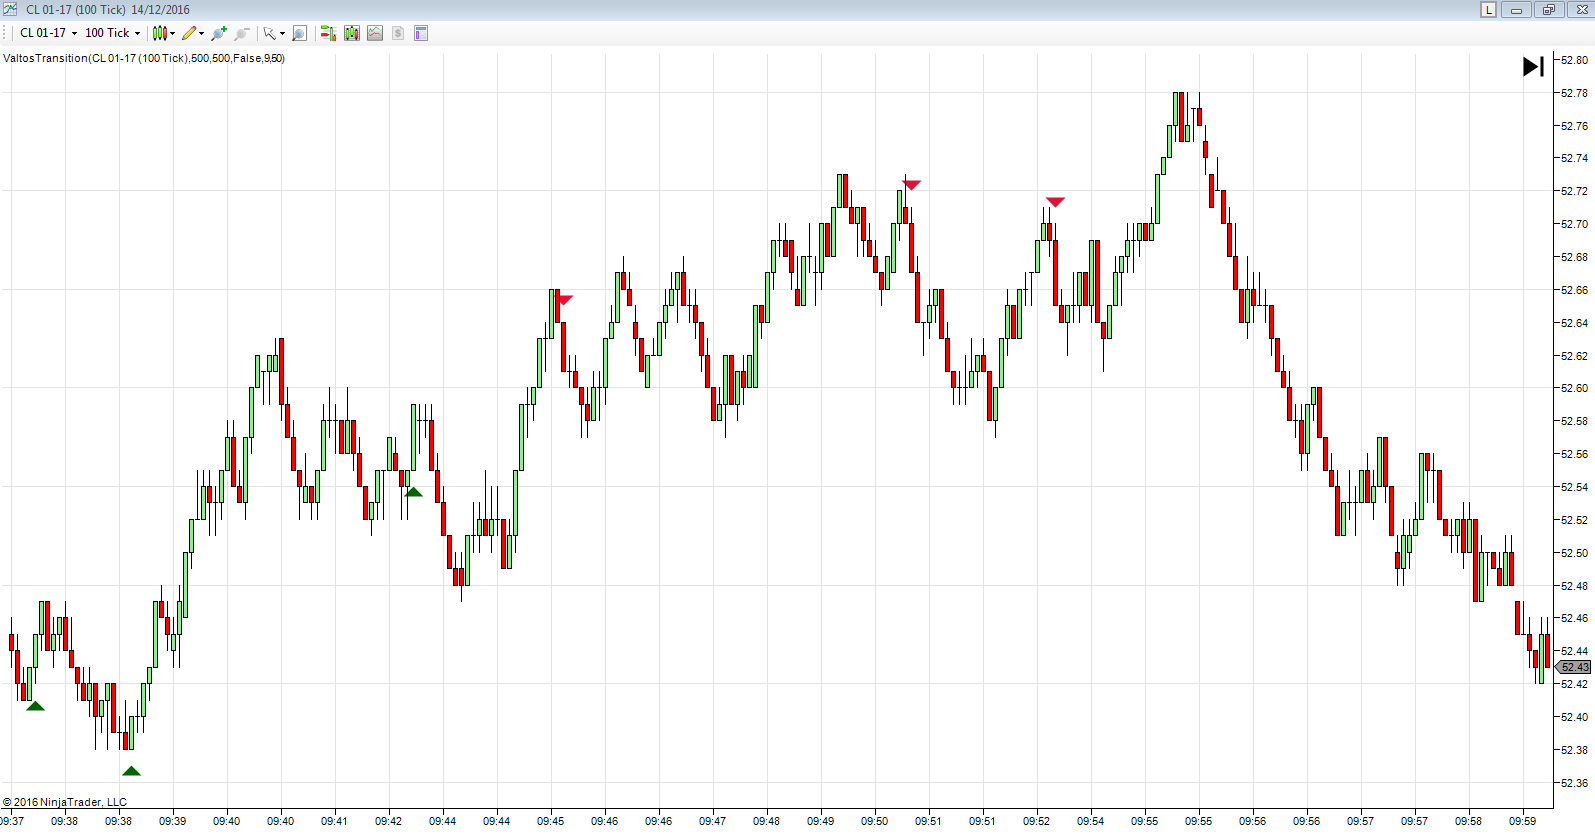
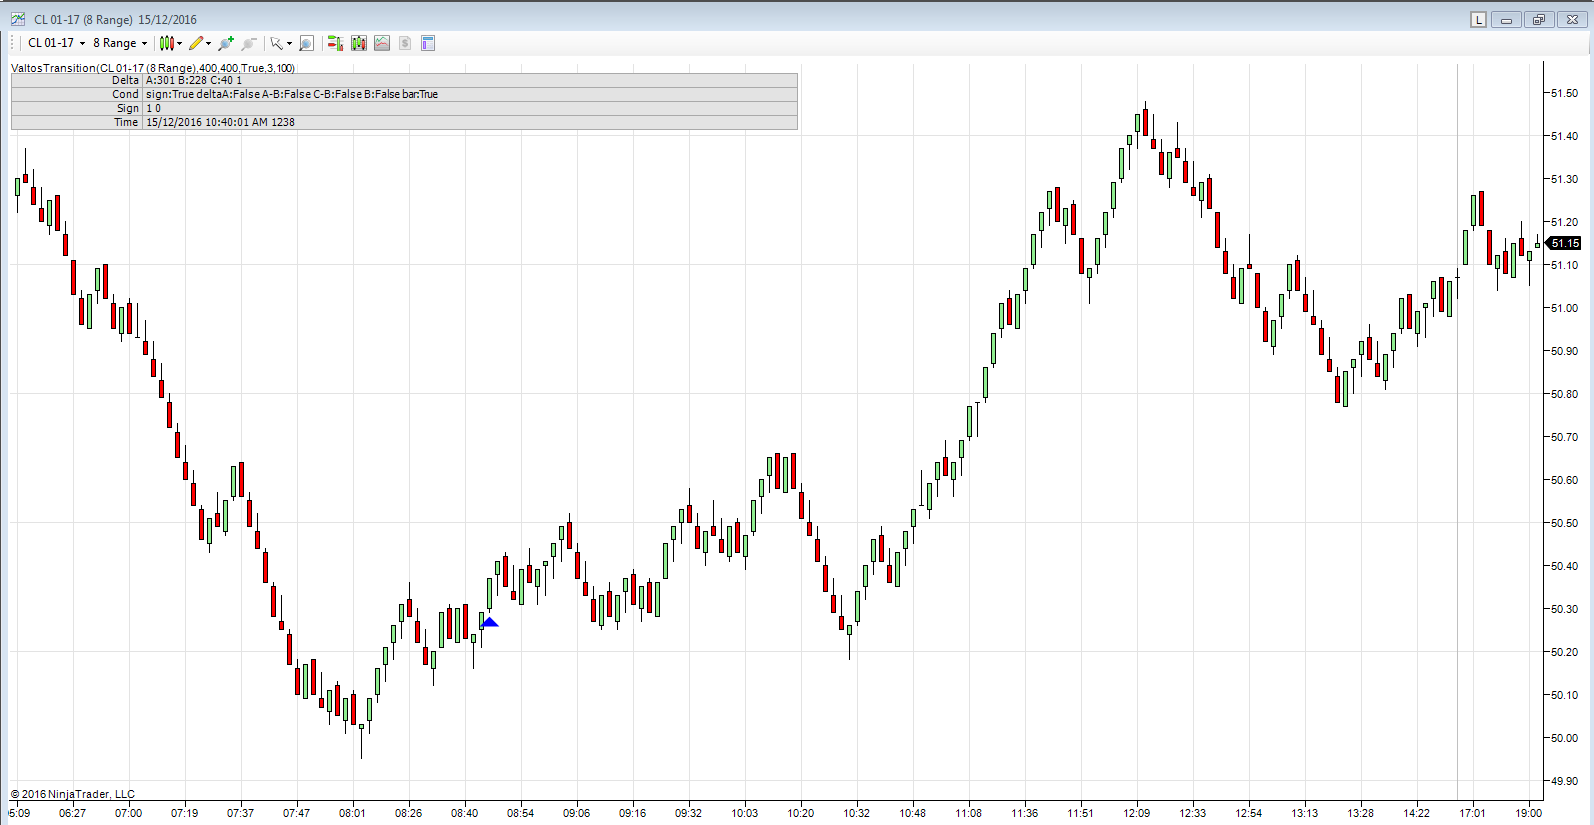
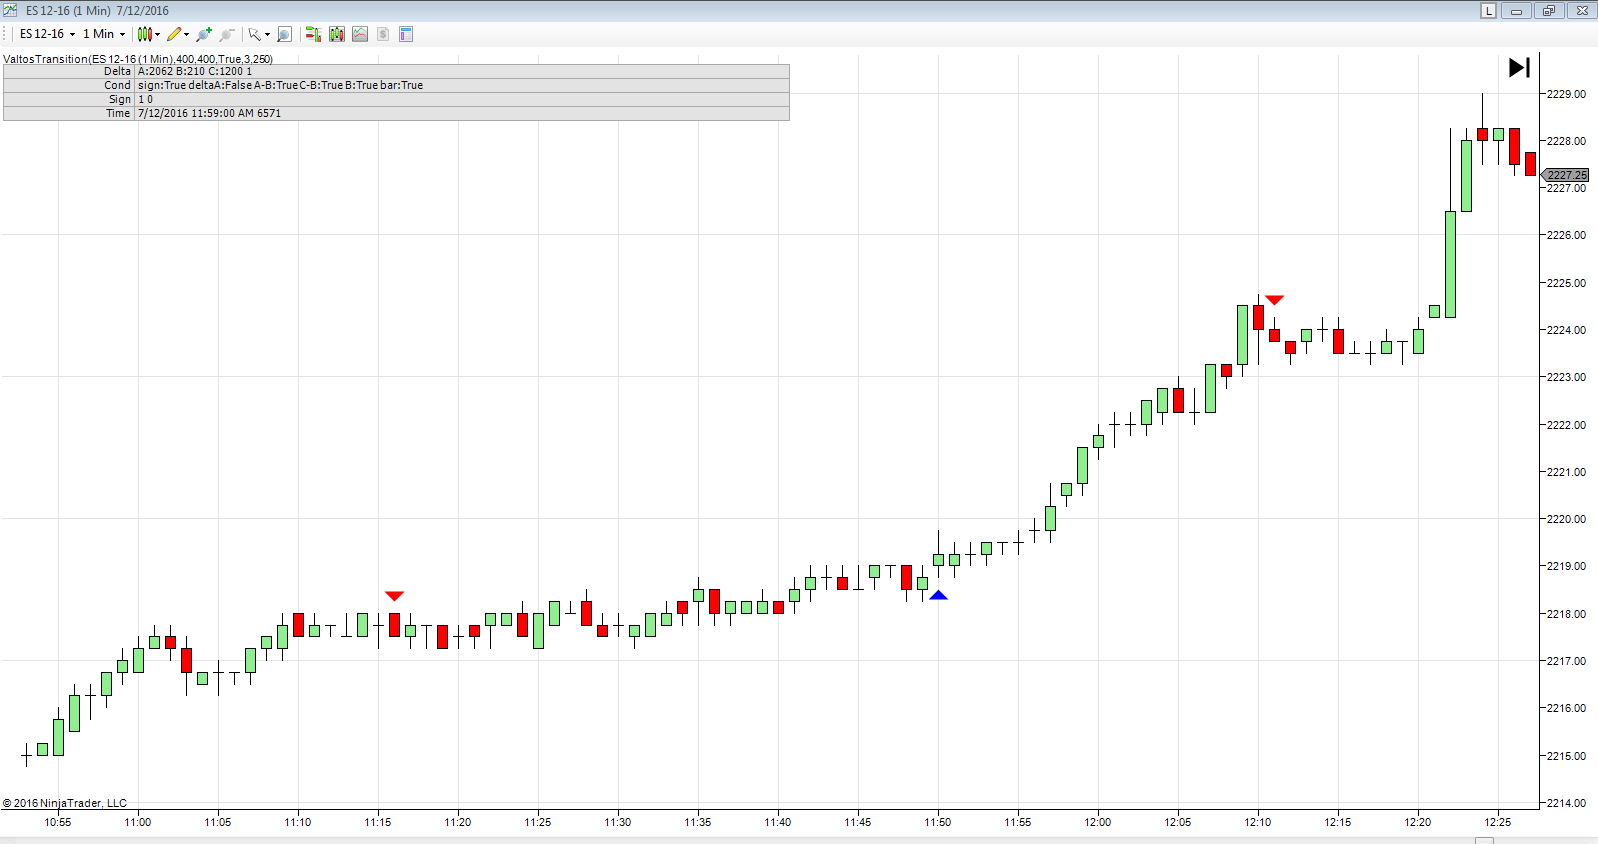
Here are some examples of the Valtos Transition in action:
![]()
Currently I have packaged The Flip, The Transition and The U-Turn in a package during my launch period where you can get access to all three indicators for the low price of $600.