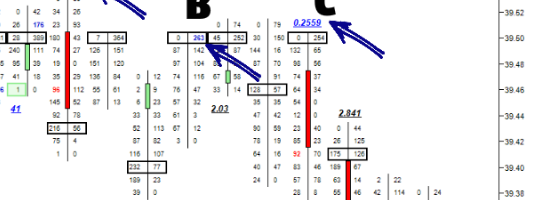
Top Heavy Big Seller / Bottom Heavy Big Buyer

There are players in the market who are so big that their actions can determine if a trend stops or starts. These large institutions know when a market has moved out of supply and demand balance and act accordingly. The beauty of order flow analysis is that their actions can be seen in the analysis of volume. Orderflows has created the ratio indicator to highlight on the chart where their activities are.
This indicator is easier to explain when it happens on a low. Imagine it like a price floor, where when price gets there it can’t go any lower because there is a big buyer there to absorb all the selling causing the market to rally.
The opposite is true when it occurs at a high. The market can’t go higher because there is a big seller offering their supply to satisfy all the buyers causing the market to fall.
What is the value in this? The reason I created this indicator is because as a former institutional trader, I would often trade big orders that would act as floors or caps to the market, at least in the short term. This could have been because the trade was a hedge or part of spread I was working against another market. It is not uncommon for a commercial commodity house to work orders in this fashion.
Only Orderflows Trader has this indicator that allows you see when there is a big buyer at a low or a big seller at a high.


