Posted by orderflows on Aug 21, 2023 in Blog
One of the comments I recently received was asking to explain the importance of Delta/Volume. Order flow traders look for unusual surges in delta/volume to anticipate potential market-moving trades by large institutions or firms. Unusual trading activity can give you clues as to the direction big traders expect the underlying to move. Delta/volume data combined with price action can help order flow traders understand when options activity is signaling a shift in sentiment...
Read More »
Posted by orderflows on Aug 22, 2015 in Hidden Trade Locations
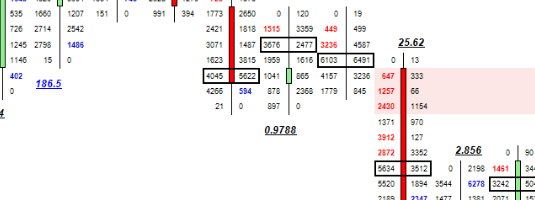
Aggressive buyers and sellers leave their mark on the market. Their levels of activity often become low risk trade entries when retested as well as support and resistance. When I say low risk, I am talking like 1, 2 or 3 ticks risk with profit potentials over 10x the risk. Orderflows has created the stacked buying imbalance and stacked selling imbalance indicators to highlight on the chart exactly where these low risk entries are. Think of stacked imbalance in real life...
Read More »
Posted by orderflows on Aug 22, 2015 in Hidden Trade Locations
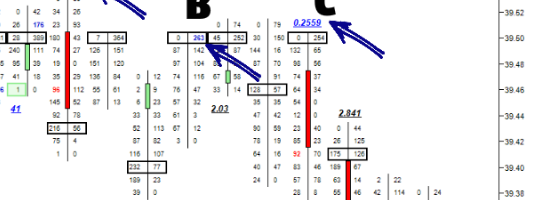
There are players in the market who are so big that their actions can determine if a trend stops or starts. These large institutions know when a market has moved out of supply and demand balance and act accordingly. The beauty of order flow analysis is that their actions can be seen in the analysis of volume. Orderflows has created the ratio indicator to highlight on the chart where their activities are. This indicator is easier to explain when it happens on a low. Imagine...
Read More »
Posted by orderflows on Aug 22, 2015 in Hidden Trade Locations
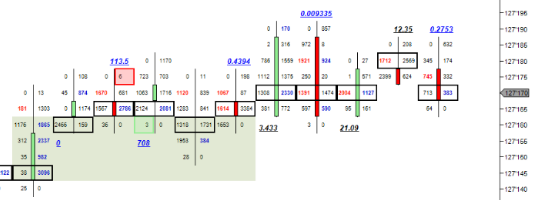
Markets turn when the last buyer has bought at a high or when the last seller has sold at a low. With traditional bar charts you only see the low of the bar or the high of the bar. You cannot judge the internal buying or selling that has been apparent inside the bar. Orderflows has created the single print box indicator to highlight on the chart where their activities are. What is the importance of the last buyer / last seller? It is important because it potentially signals...
Read More »
Posted by orderflows on Aug 22, 2015 in Hidden Trade Locations
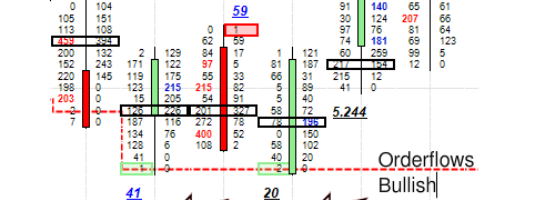
When the market makes a new high but there were more sellers in the bar or when the market makes a new low but there were more buyers in the bar. This often signals a turning point in the market. The market tried to go higher but couldn’t and was overwhelmed by sellers. The same is true at lows, the market was going lower and lower until the buyers stepped in and overwhelmed the sellers. Orderflows has created the Orderflows Divergence Indicator to draw an arrow on the...
Read More »