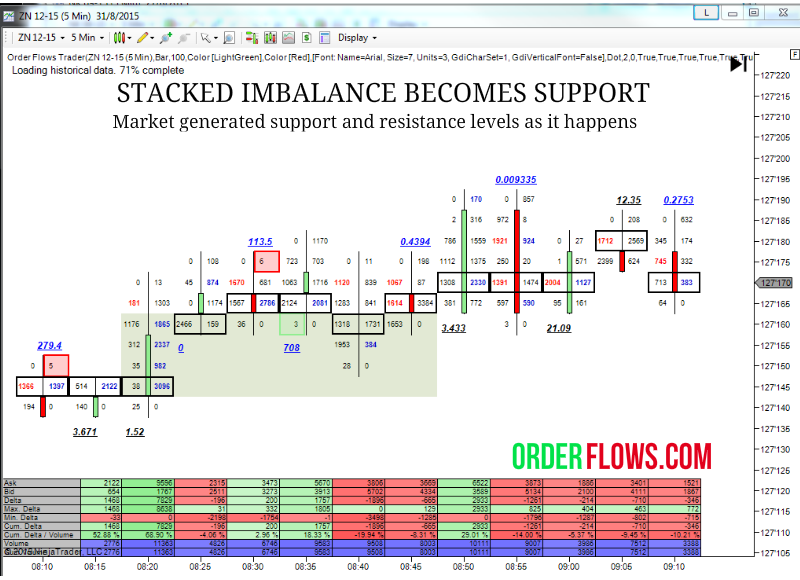
Imbalance Support And Resistance
Aggressive buyers and sellers leave their mark on the market. Their levels of activity often become low risk trade entries when retested as well as support and resistance. When I say low risk, I am talking like 1, 2 or 3 ticks risk with profit potentials over 10x the risk. Orderflows has created the stacked buying imbalance and stacked selling imbalance indicators to highlight on the chart exactly where these low risk entries are.
Think of stacked imbalance in real life terms. Suppose you are a baker and you need to buy eggs to make your cakes. It is a supply you need every day. Usually you pay $1.00 a dozen, but the price is going up. You know you need to buy eggs every day. At $1.05 you can still make money with your cakes, so you buy a bunch of eggs at $1.05. More than normal and then the price goes up to $1.10 but you don’t buy anymore eggs because at that level it is just too expensive for you. But the price of eggs starts to drop a week later on the lack of overall demand, you need more eggs so you wait for it to come back to $1.05 then you start buying again. Understand better now?
I created an indicator in the Orderflows Trader that draws these areas of market generated support and resistance on the chart so you can see the areas you should be trading around.